Fig. 10
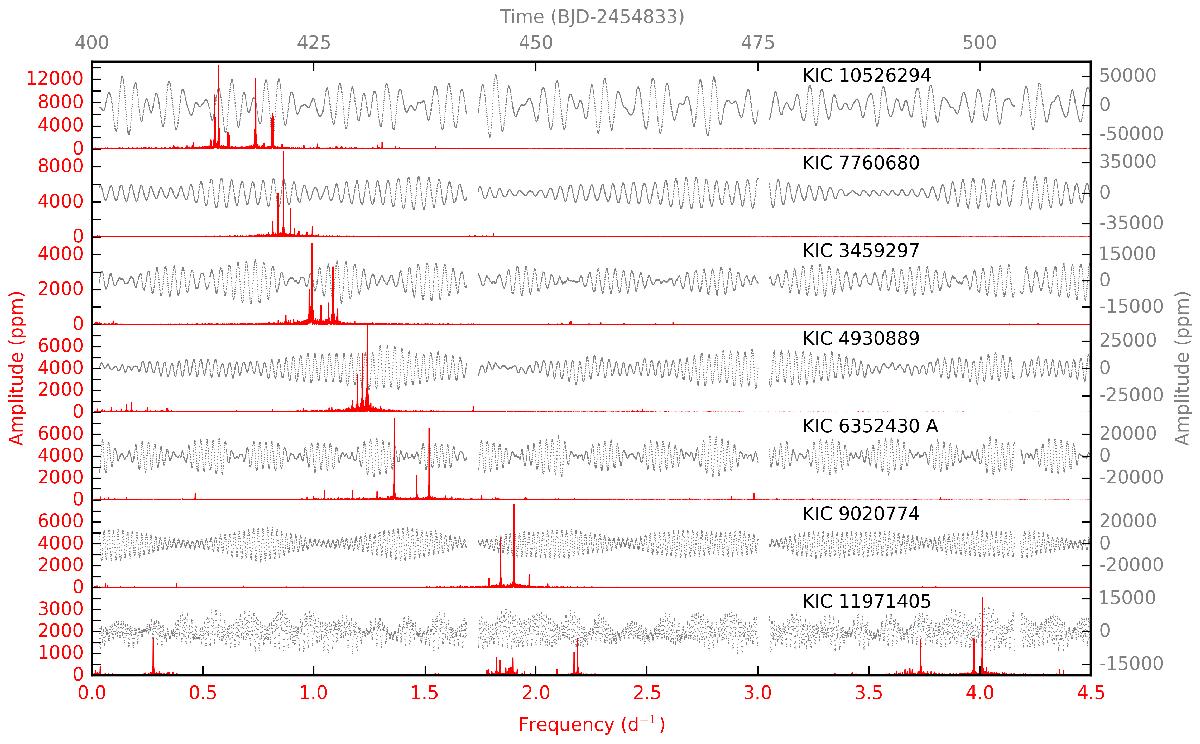
Light curves (plotted using grey dots, showing a zoom-in to slightly less than 1/10th of the full data set) and the power spectra (plotted using red solid lines) of the five SPB stars studied in this paper along with the ones of KIC 10526294 and KIC 7760680 from Pápics et al. (2014, 2015) ordered according to the frequency of maximum power. For further information see Sect. 3.5.
Current usage metrics show cumulative count of Article Views (full-text article views including HTML views, PDF and ePub downloads, according to the available data) and Abstracts Views on Vision4Press platform.
Data correspond to usage on the plateform after 2015. The current usage metrics is available 48-96 hours after online publication and is updated daily on week days.
Initial download of the metrics may take a while.