Fig. 11
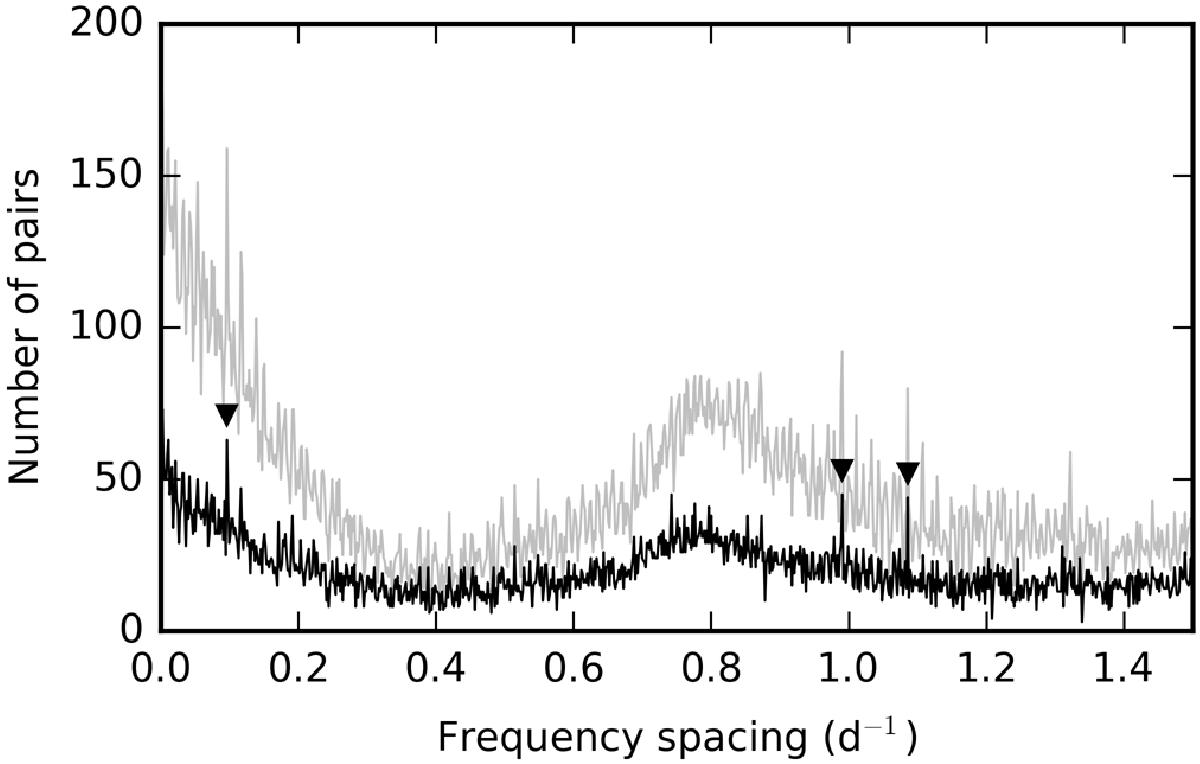
Histogram of the distribution of frequency pairs in the frequency analysis of KIC 3459297, calculated using a bin width of 2.5 /T taking into account all statistically significant frequencies (grey solid line), or only a subset of frequencies where weaker signal from within 2.5 /T of the stronger peaks was excluded (black solid line). The three values that are mentioned in the text are marked with black triangles.
Current usage metrics show cumulative count of Article Views (full-text article views including HTML views, PDF and ePub downloads, according to the available data) and Abstracts Views on Vision4Press platform.
Data correspond to usage on the plateform after 2015. The current usage metrics is available 48-96 hours after online publication and is updated daily on week days.
Initial download of the metrics may take a while.