Fig. 26
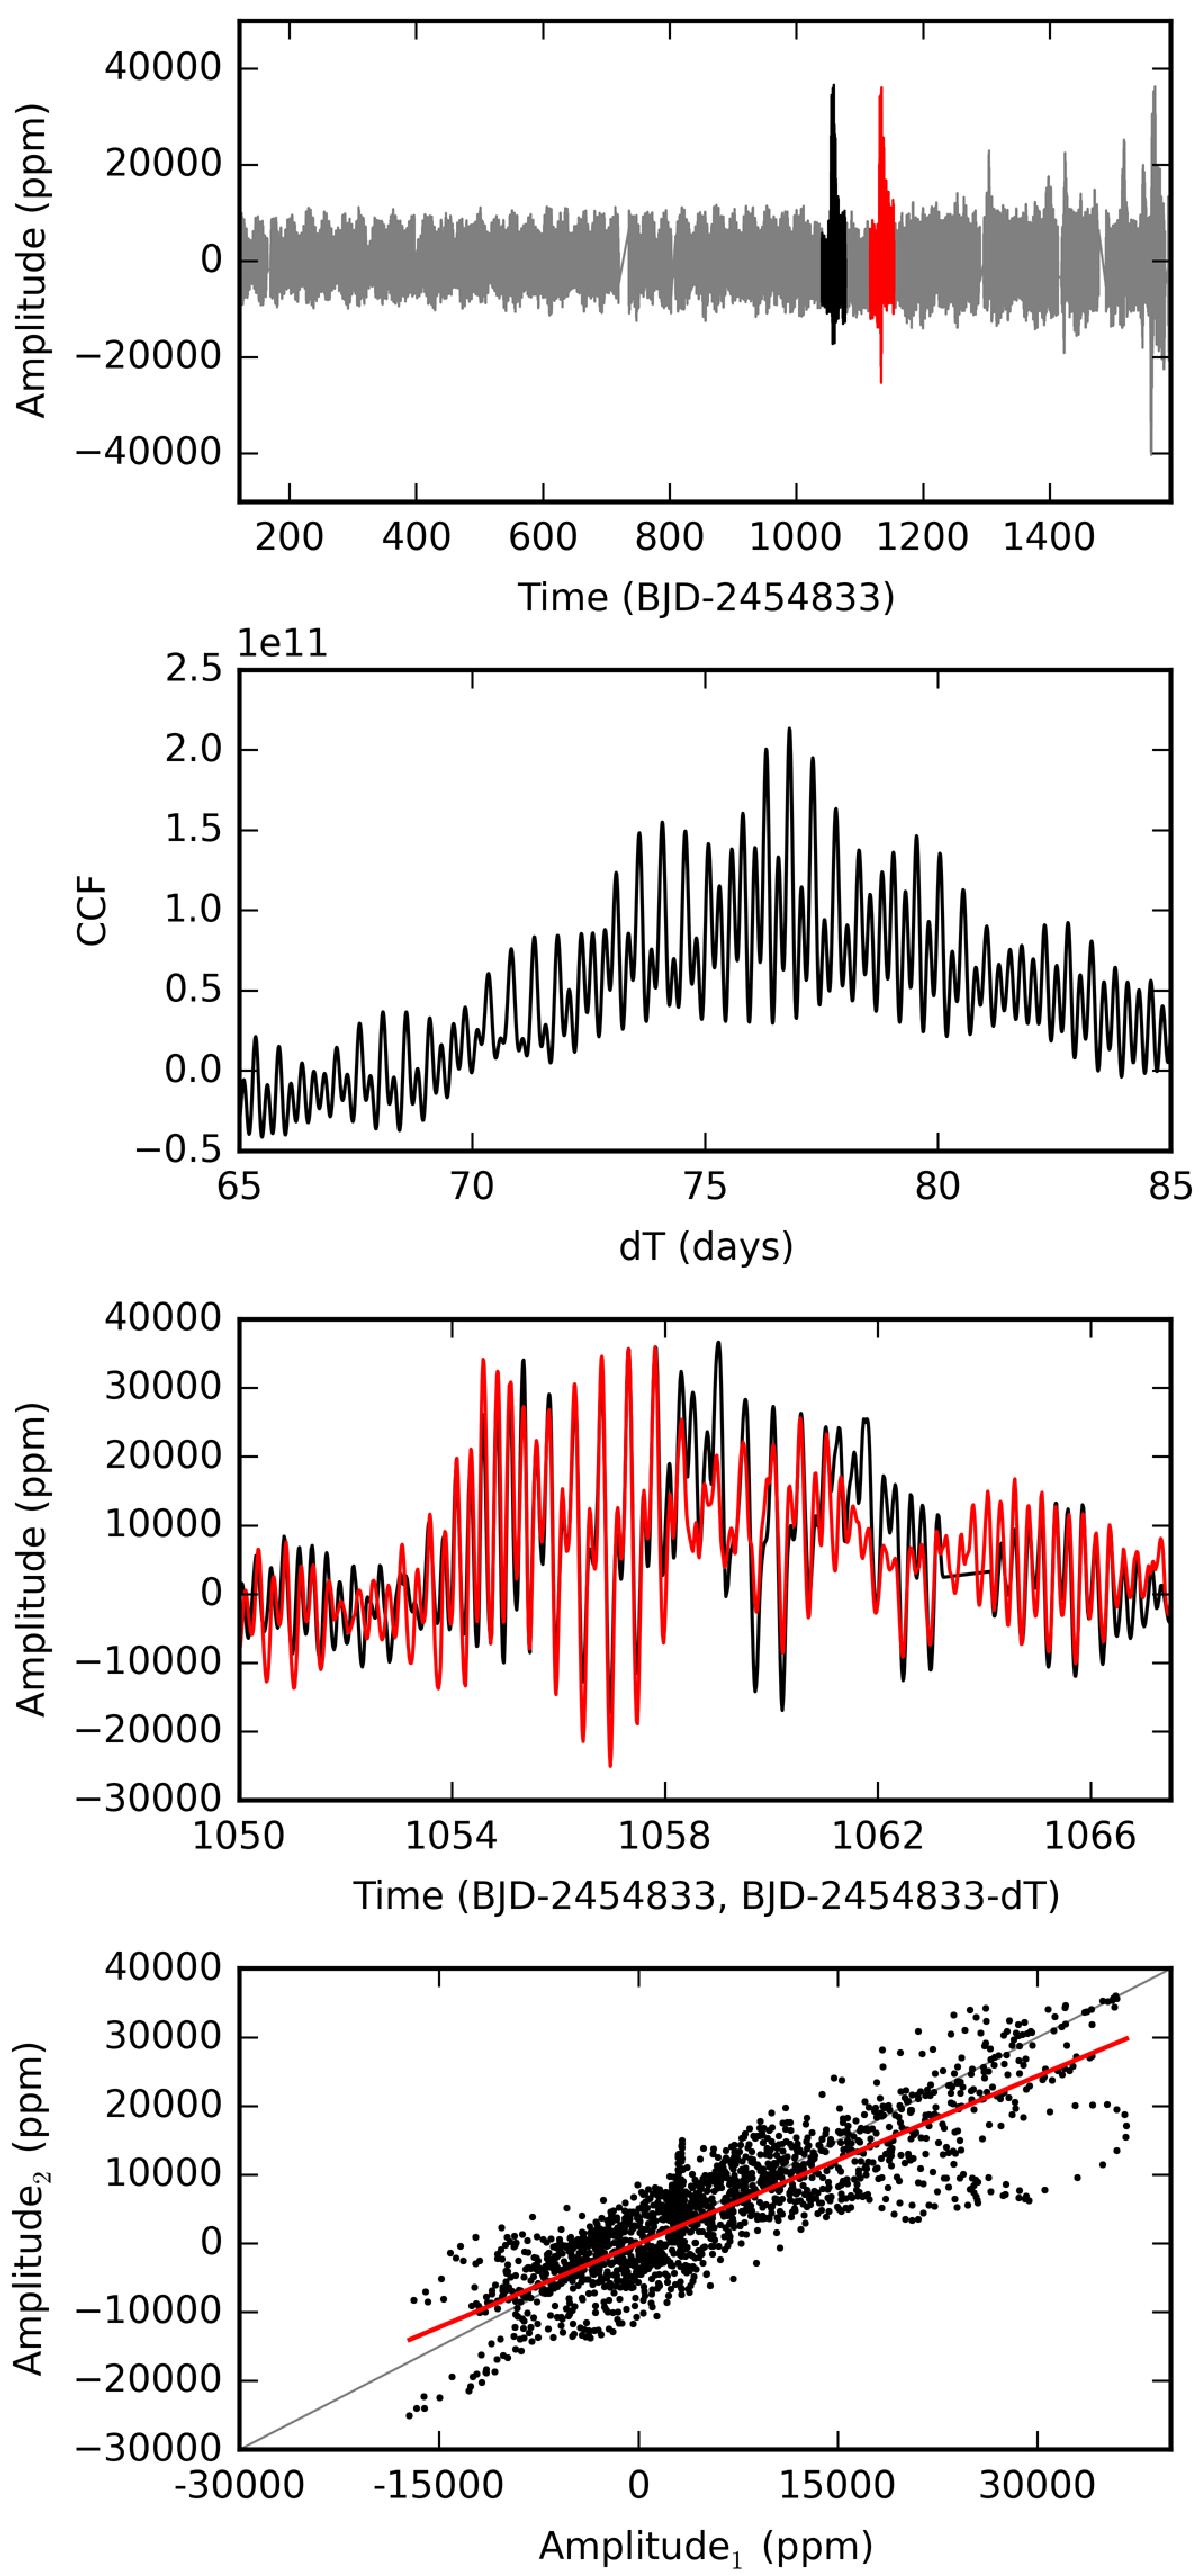
Upper panel: full detrended light curve of KIC 11971405 (in grey) with the regions of the two most prominent outburst indicated in black and red. Second panel: the cross-correlation function of the two outbursts. Third panel: the second outburst (red solid line) shifted back in time with dT = 76.81 d (the value of the highest peak in the CCF function on the second panel) and plotted over the first outburst (black solid line). The match between the two light curves, especially around the maximum amplitude phase, is impressive. Lower panel: a correlation diagram between the observed photometric signal of the two outbursts in the range shown on the third panel. A 1:1 line is plotted in the background as a grey solid line, and the best-fit linear through the scatter plot is plotted using a red solid line (y = 0.81 ± 0.01 × x, R2 = 0.79).
Current usage metrics show cumulative count of Article Views (full-text article views including HTML views, PDF and ePub downloads, according to the available data) and Abstracts Views on Vision4Press platform.
Data correspond to usage on the plateform after 2015. The current usage metrics is available 48-96 hours after online publication and is updated daily on week days.
Initial download of the metrics may take a while.