Free Access
Fig. 3
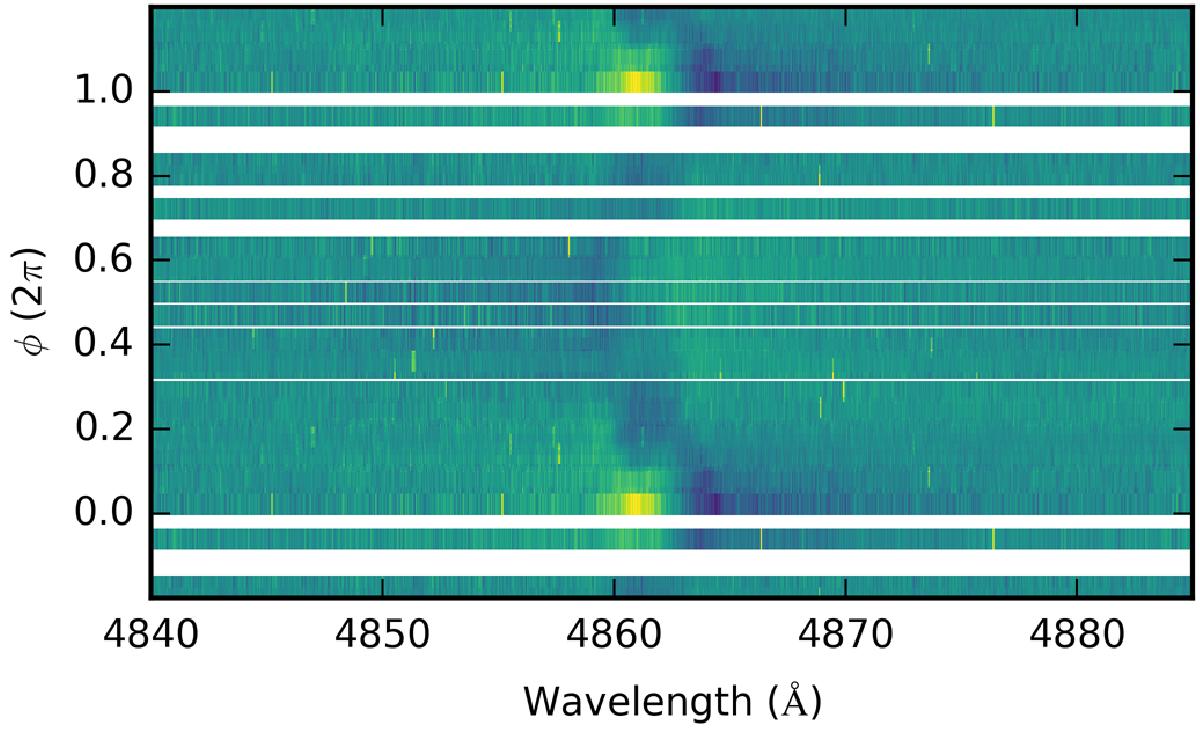
Phase-folded residual spectra of KIC 4930889 around the H i line at 4861 Å obtained after subtraction of the average. The colour scale represents the residual intensity at each wavelength point. White horizontal regions denote phases that are more than 0.05π away from an observed spectrum.
Current usage metrics show cumulative count of Article Views (full-text article views including HTML views, PDF and ePub downloads, according to the available data) and Abstracts Views on Vision4Press platform.
Data correspond to usage on the plateform after 2015. The current usage metrics is available 48-96 hours after online publication and is updated daily on week days.
Initial download of the metrics may take a while.