Fig. 5
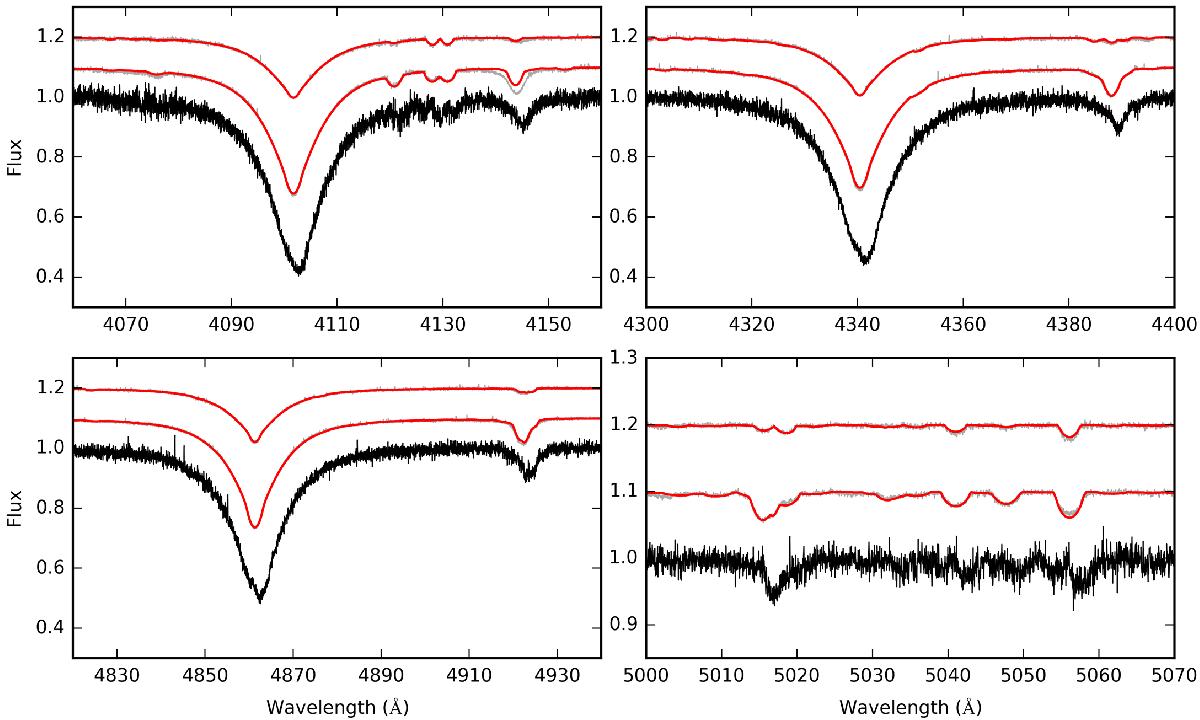
Comparison of the Hermes spectrum at the phase of the largest observed radial velocity difference, disentangled component spectra, and synthetic spectra for each component for selected wavelength regions of KIC 4930889. In each panel, the Hermes spectrum is plotted with a black solid line, the disentangled spectra are plotted with grey solid lines, and synthetic spectra (scaled to the disentangled spectra) are plotted with red solid lines. For clarity, the primary and secondary spectra are plotted with a vertical offset of + 0.1 and + 0.2 flux units, respectively.
Current usage metrics show cumulative count of Article Views (full-text article views including HTML views, PDF and ePub downloads, according to the available data) and Abstracts Views on Vision4Press platform.
Data correspond to usage on the plateform after 2015. The current usage metrics is available 48-96 hours after online publication and is updated daily on week days.
Initial download of the metrics may take a while.