Fig. 8
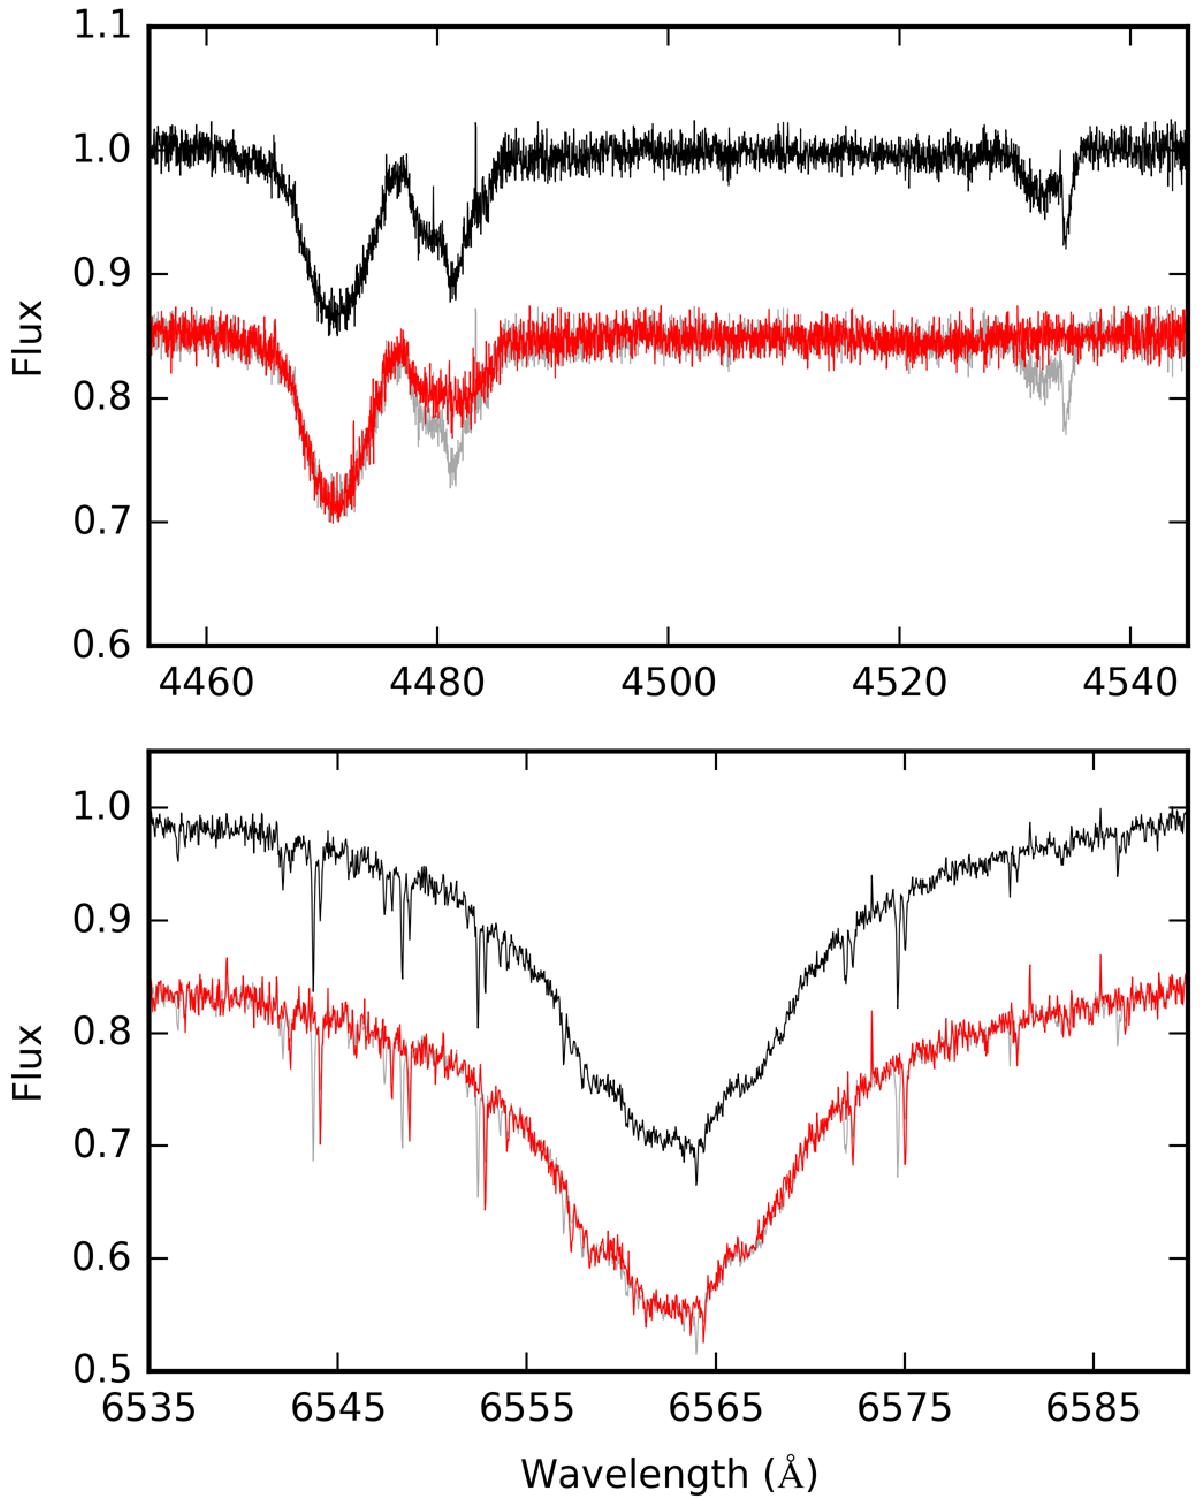
Temporal changes in the spectrum of KIC 11971405. The average of the two consecutive exposures from October 2010 is plotted on the top using a black solid line, while the average spectrum from June 2015 is shown below with a red solid line with an offset of −0.15 in flux units. For clarity, the average from 2010 is repeated in the background using a grey solid line. The sharp absorption features in the bottom panel are telluric lines.
Current usage metrics show cumulative count of Article Views (full-text article views including HTML views, PDF and ePub downloads, according to the available data) and Abstracts Views on Vision4Press platform.
Data correspond to usage on the plateform after 2015. The current usage metrics is available 48-96 hours after online publication and is updated daily on week days.
Initial download of the metrics may take a while.