Fig. 1
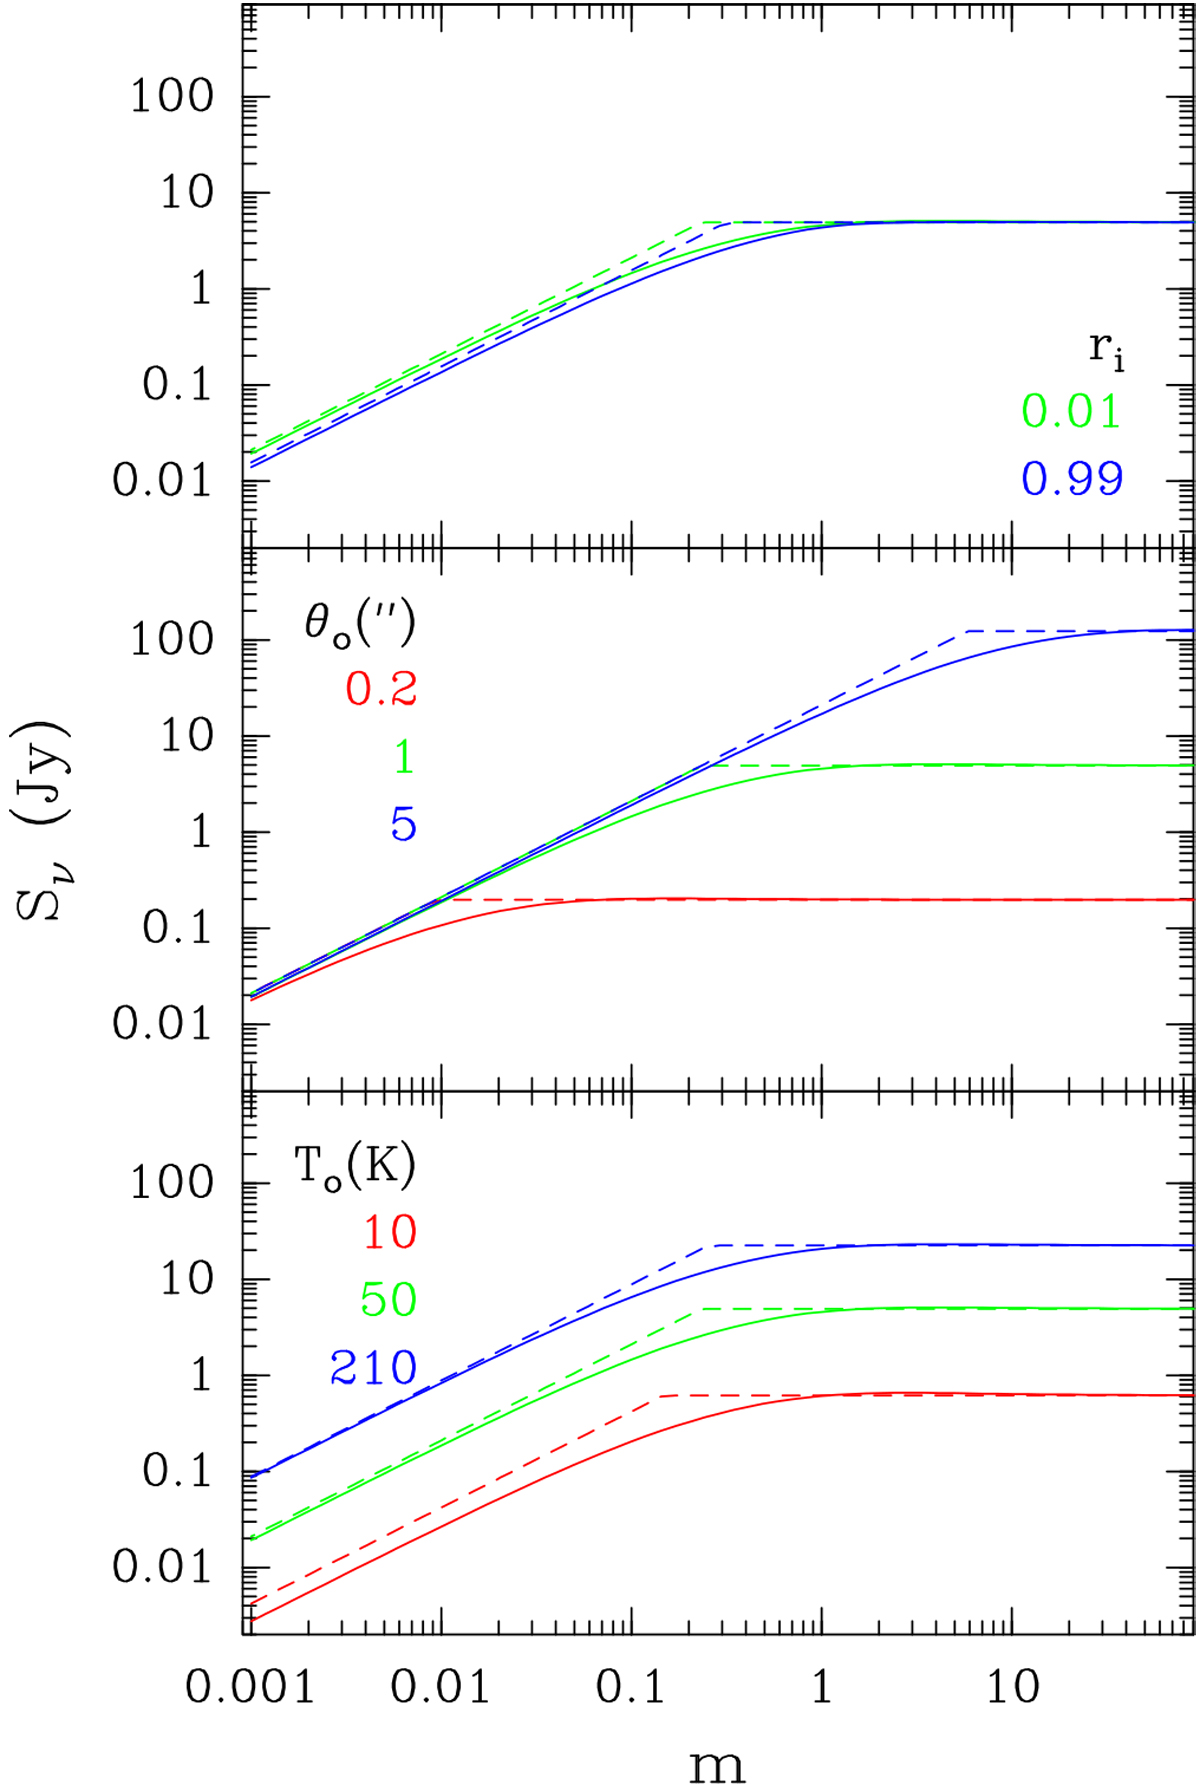
Template flux densities from a spherical dusty clump as a function of parameter m (see text).The curves are obtained for illustrative purposes from fiducial values of the input parameters: ν = 220 GHz, θo = Ro ∕d = 1′′, ri = 0.01, To = 50 K, q = −0.4, p = −1.5. In each panel only one of these parameters is changed, as indicated in the panel itself. Dashed curves represent the approximate analytical solutions given by Eq. (9), while solid curves are obtained from the numerical model described in Sect. 2.2.
Current usage metrics show cumulative count of Article Views (full-text article views including HTML views, PDF and ePub downloads, according to the available data) and Abstracts Views on Vision4Press platform.
Data correspond to usage on the plateform after 2015. The current usage metrics is available 48-96 hours after online publication and is updated daily on week days.
Initial download of the metrics may take a while.