Fig. 3
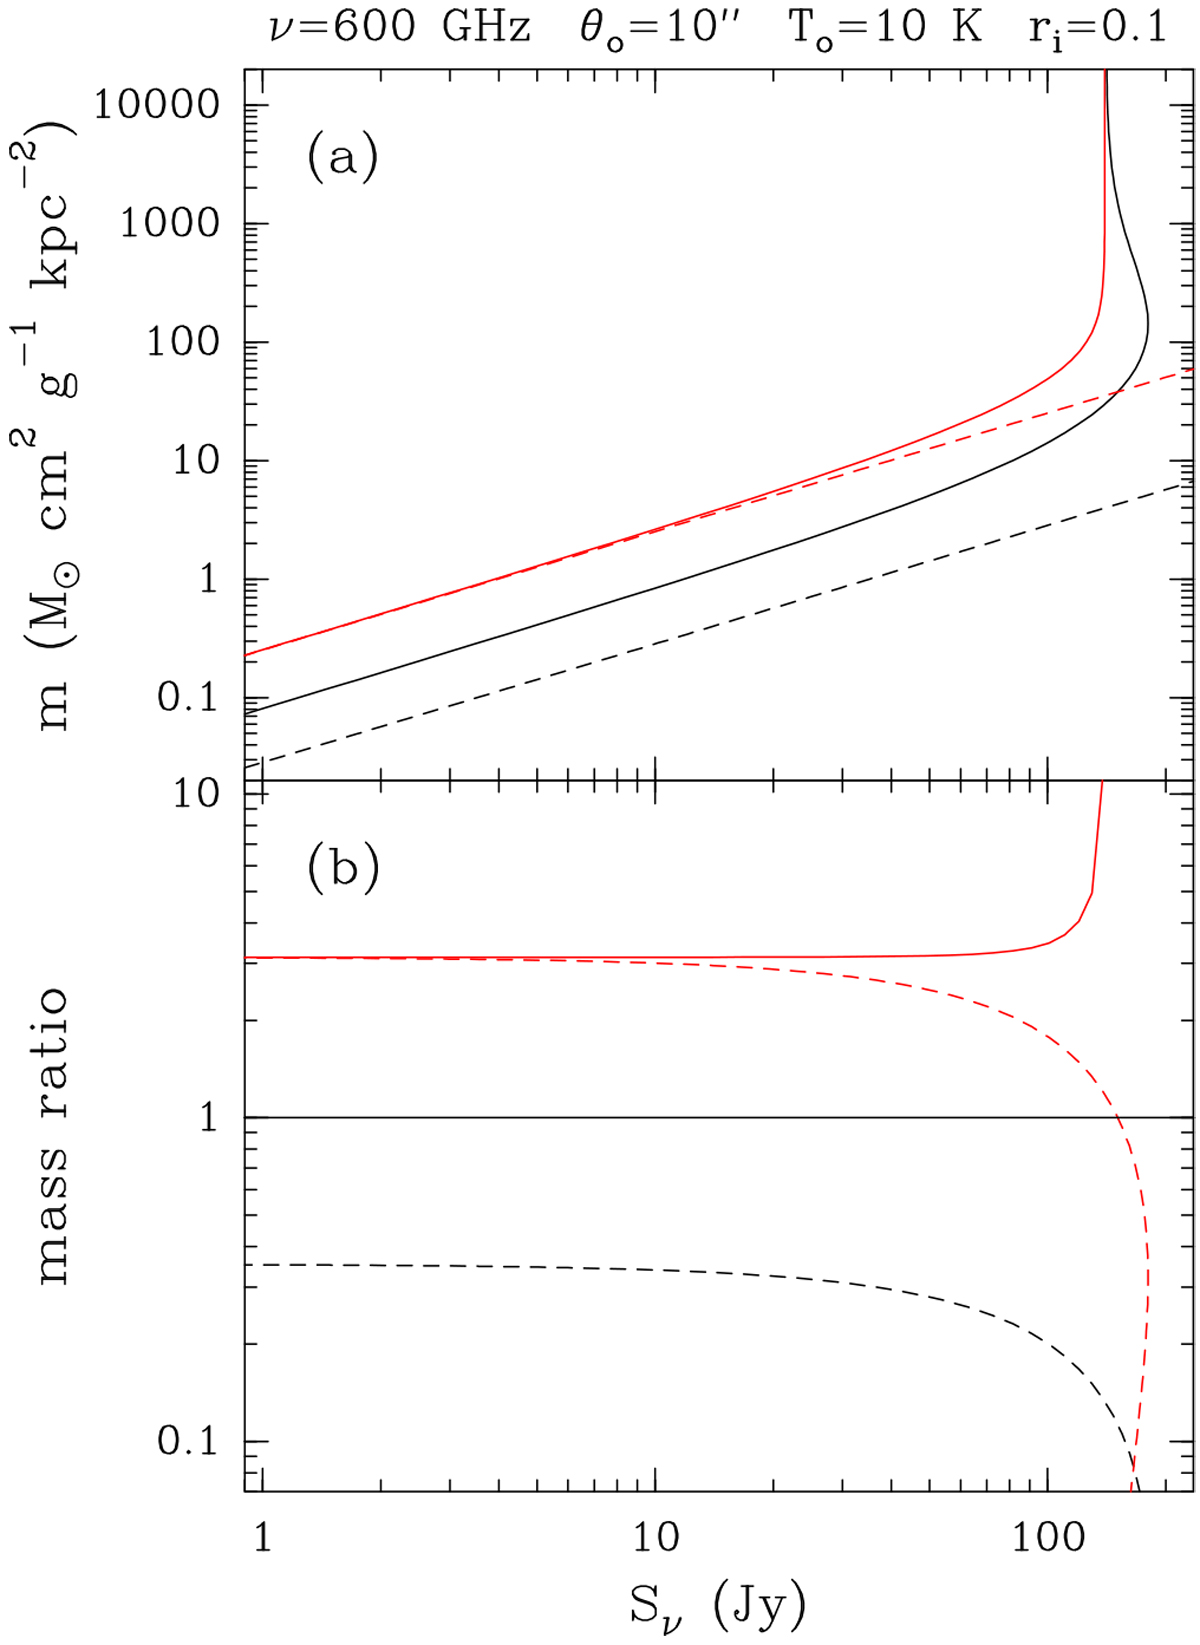
Panel a: m versus the total flux density of the clump. The red curves correspond to the case q = 0 and p = 0, while the black curves are for models allowing for temperature and density gradients. The dashed black curve has been obtained under the optically thin and RJ approximations from Eq. (11), whereas the dashed red curve is computed in the optically thin limit from Eq. (1). Panel b: mass ratios between all the curves in the top panel and the black solid curve.
Current usage metrics show cumulative count of Article Views (full-text article views including HTML views, PDF and ePub downloads, according to the available data) and Abstracts Views on Vision4Press platform.
Data correspond to usage on the plateform after 2015. The current usage metrics is available 48-96 hours after online publication and is updated daily on week days.
Initial download of the metrics may take a while.