Fig. 7
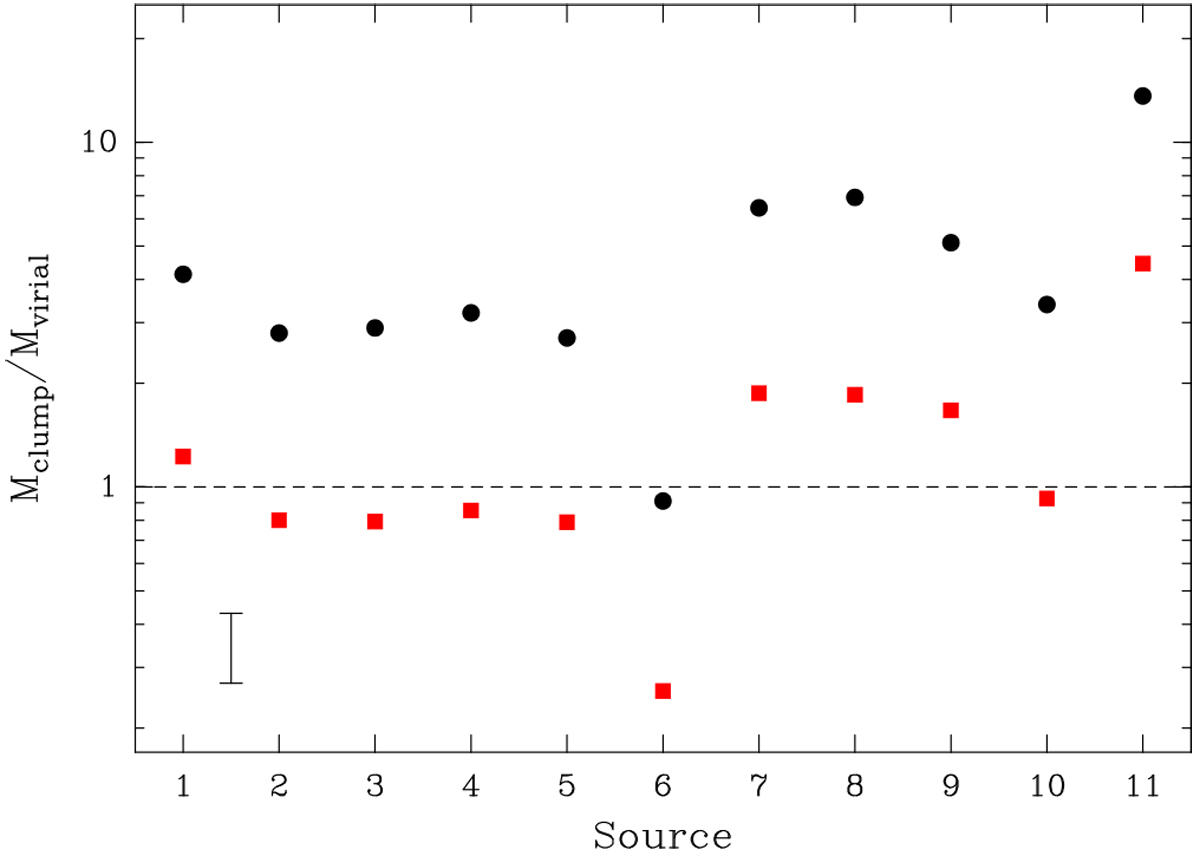
Same as Fig. 6 in FON02, where the clump masses are recomputed with our numerical solution using the temperature, radii, and flux densities from the ATLASGAL compact source catalogue, and the virial masses are corrected to take into account density and temperature gradients. The numbers on the x-axis identify the clumps according to the numbering of Table 1 of FON02. Black circles correspond to constant density and temperature, as assumed by FON02, whereas red squares are obtained adopting q = −0.54 and p = −2.6, consistent with the findings of FON02. The error bar in the bottom left corner indicates the typical uncertainty on the mass ratio.
Current usage metrics show cumulative count of Article Views (full-text article views including HTML views, PDF and ePub downloads, according to the available data) and Abstracts Views on Vision4Press platform.
Data correspond to usage on the plateform after 2015. The current usage metrics is available 48-96 hours after online publication and is updated daily on week days.
Initial download of the metrics may take a while.