Fig. 8
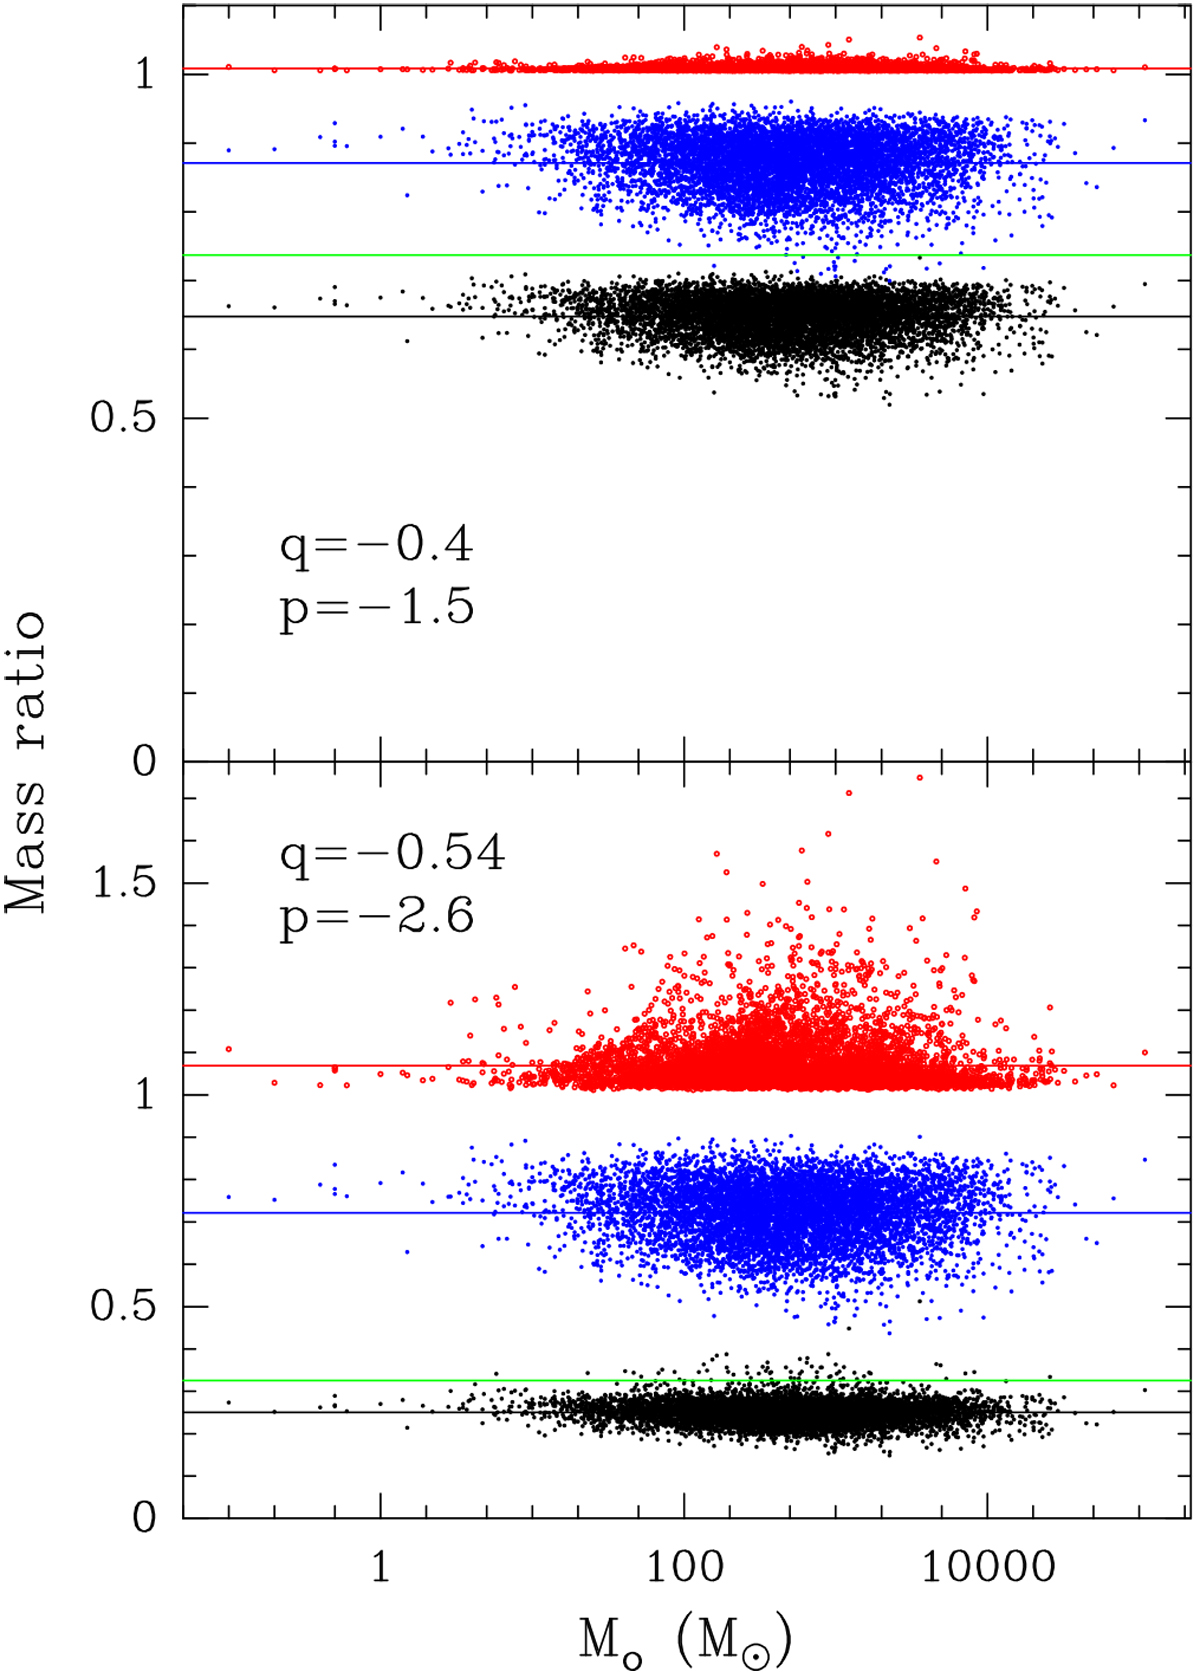
Ratio of the mass estimated with our numerical model to that computed by URQ18 for the compact sources identified in the ATLASGAL survey (black dots). The input parameters are taken from URQ18. For our estimates, we assumed two template cases: q = −0.4, p = −1.5 (top panel) and q = −0.54, p = −2.6 (bottom panel). The red and blue dots indicate, respectively, the contribution of opacity and RJ approximation to the mass ratio, with the horizontal lines denoting the corresponding mean values for the black dots (0.64 top panel; 0.25 bottom panel), red dots (1.01 top panel; 1.07 bottom panel), and blue dots (0.87 top panel; 0.72 bottom panel). The green line is the factor (0.74 top panel; 0.33 bottom panel) taking into account temperature and density gradients (see text for a detailed explanation).
Current usage metrics show cumulative count of Article Views (full-text article views including HTML views, PDF and ePub downloads, according to the available data) and Abstracts Views on Vision4Press platform.
Data correspond to usage on the plateform after 2015. The current usage metrics is available 48-96 hours after online publication and is updated daily on week days.
Initial download of the metrics may take a while.