Fig. 2.
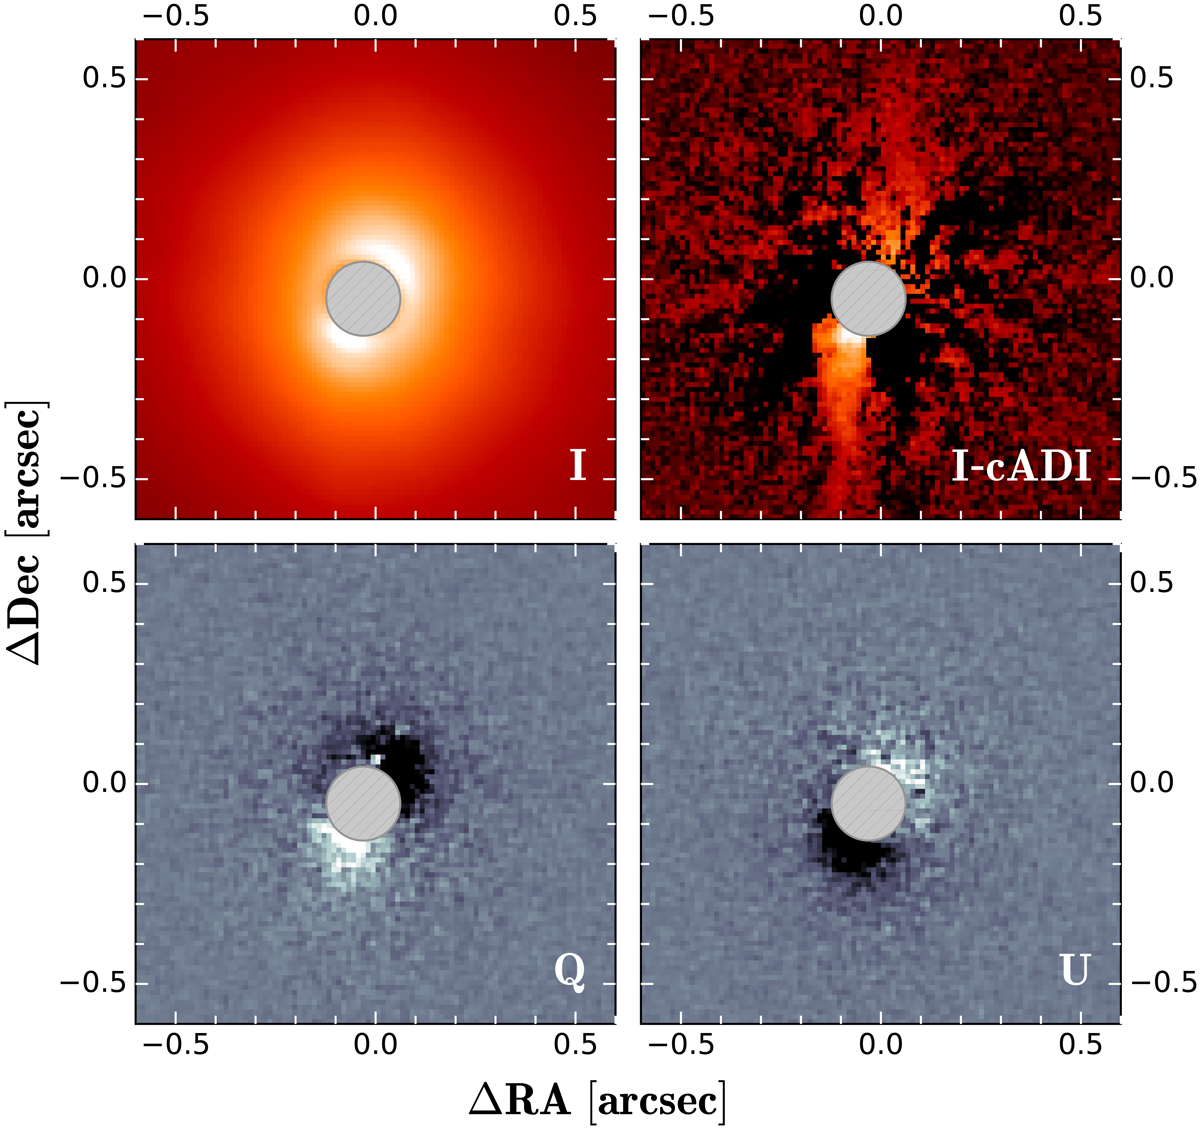
Coronagraphic images of ET Cha taken with SPHERE/IRDIS in our program. Upper left: stacked total intensity image. Upper right: total intensity image after classical angular differential imaging reduction. Bottom: Stokes Q and U polarized flux images after polarization differential imaging. The size of the coronagraphic mask is indicated with the grey, hashed circle. The positive-negative signal pattern is caused by unresolved stellar polarization of the primary star, the companion or both and not by a resolved circumstellar disk.
Current usage metrics show cumulative count of Article Views (full-text article views including HTML views, PDF and ePub downloads, according to the available data) and Abstracts Views on Vision4Press platform.
Data correspond to usage on the plateform after 2015. The current usage metrics is available 48-96 hours after online publication and is updated daily on week days.
Initial download of the metrics may take a while.