Free Access
Fig. 1.
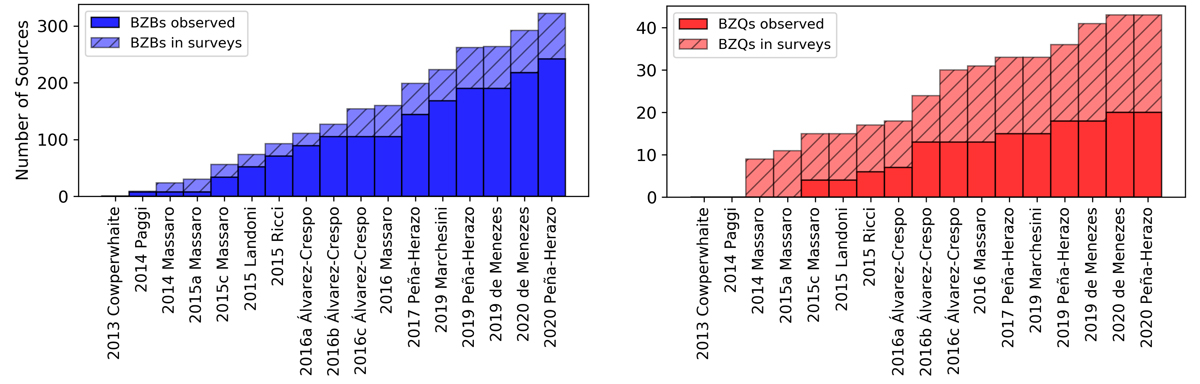
Cumulative distributions of all sources observed during our spectroscopic campaign (solid bars) and classified as BZBs (left panel in blue) or BZQs (right panel in red) in addition to those found in our archival searches of other spectroscopic surveys (hatched bars).
Current usage metrics show cumulative count of Article Views (full-text article views including HTML views, PDF and ePub downloads, according to the available data) and Abstracts Views on Vision4Press platform.
Data correspond to usage on the plateform after 2015. The current usage metrics is available 48-96 hours after online publication and is updated daily on week days.
Initial download of the metrics may take a while.