| Issue |
A&A
Volume 643, November 2020
|
|
|---|---|---|
| Article Number | A103 | |
| Number of page(s) | 23 | |
| Section | Extragalactic astronomy | |
| DOI | https://doi.org/10.1051/0004-6361/202037978 | |
| Published online | 09 November 2020 | |
Optical spectroscopic observations of low-energy counterparts of Fermi-LAT γ-ray sources⋆
1
Dipartimento di Fisica, Università degli Studi di Torino, via Pietro Giuria 1, 10125 Torino, Italy
e-mail: This email address is being protected from spambots. You need JavaScript enabled to view it.
2
Instituto Nacional de Astrofísica, Óptica y Electrónica, Apartado Postal 51-216, 72000 Puebla, México
3
Istituto Nazionale di Fisica Nucleare, Sezione di Torino, 10125 Torino, Italy
4
INAF-Osservatorio Astrofisico di Torino, via Osservatorio 20, 10025 Pino Torinese, Italy
5
Consorzio Interuniversitario per la Fisica Spaziale (CIFS), via Pietro Giuria 1, 10125 Torino, Italy
6
Universidade de São Paulo, Departamento de Astronomia, São Paulo SP 05508-090, Brazil
7
Facultad de Ciencias Astronómicas y Geofísicas, Universidad Nacional de La Plata, La Plata, Argentina
8
Instituto de Astrofísica de La Plata, CONICET-UNLP, CCT La Plata, La Plata, Argentina
9
INAF-Osservatorio di Astrofisica e Scienza dello Spazio, via Gobetti 93/3, 40129 Bologna, Italy
10
INAF-Osservatorio Astronomico di Cagliari, via della Scienza 5, Selargius, CA, Italy
11
INAF-Osservatorio Astronomico di Brera, Via Emilio Bianchi 46, 23807 Merate, Italy
12
Departamento de Ciencias Físicas, Universidad Andrés Bello, Fernández Concha 700, Las Condes, Santiago, Chile
13
Instituto de Astrofísica and Centro de Astroingeniería, Facultad de Física, Pontificia Universidad Catolica de Chile, Casilla 306, Santiago 22, Chile
14
Center for Astrophysics | Harvard & Smithsonian, 60 Garden Street, Cambridge, MA 02138, USA
15
Naval Research Laboratory, Space Science Division, Code 7650 Washington, DC 20375, USA
16
Dipartimento di Matematica e Fisica, Università degli Studi Roma Tre, Via della Vasca Navale 84, 00146 Roma, Italy
17
Department of Physics and Astronomy, Purdue University, 525 Northwestern Avenue, West Lafayette, IN 47907, USA
18
Instituto de Astronomía, Universidad Nacional Autónoma de México, Apdo. Postal 877, Ensenada, 22800 Baja California, México
19
Max-Planck-Institut für Radioastronomie, Auf dem Hügel 69, 53121 Bonn, Germany
20
Dipartimento di Fisica, Università degli Studi di Perugia, 06123 Perugia, Italy
Received:
18
March
2020
Accepted:
20
August
2020
Abstract
Context. A significant fraction of all γ-ray sources detected by the Large Area Telescope aboard the Fermi satellite is still lacking a low-energy counterpart. In addition, there is still a large population of γ-ray sources with associated low-energy counterparts that lack firm classifications. In the last 10 years we have undertaken an optical spectroscopic campaign to address the problem of unassociated or unidentified γ-ray sources (UGSs), mainly devoted to observing blazars and blazar candidates because they are the largest population of γ-ray sources associated to date.
Aims. Here we describe the overall impact of our optical spectroscopic campaign on sources associated in Fermi-LAT catalogs, coupled with objects found in the literature. In the literature search we kept track of efforts by different teams that presented optical spectra of counterparts or potential counterparts of Fermi-LAT catalog sources. Our summary includes an analysis of additional 30 newly collected optical spectra of counterparts or potential counterparts of Fermi-LAT sources of a previously unknown nature.
Methods. New spectra were acquired at the Blanco 4 m and OAN-SPM 2.1 m telescopes, and those available in the Sloan Digital Sky Survey (data release 15) archive.
Results. All new sources with optical spectra analyzed here are classified as blazars. Thanks to our campaign, altogether we discovered and classified 394 targets with an additional 123 objects collected from a literature search. We began our optical spectroscopic campaign between the release of the second and third Fermi-LAT source catalogs (2FGL and 3FGL, respectively), classified about 25% of the sources that had uncertain nature and discovered a blazar-like potential counterpart for ∼10% of UGSs listed therein. In the 4FGL catalog, about 350 Fermi-LAT sources have been classified to date thanks to our campaign.
Conclusions. The most elusive class of blazars are found to be BL Lacs since the largest fraction of Fermi-LAT sources targeted in our observations showed a featureless optical spectrum. The same conclusion applied to the literature spectra. Finally, we confirm the high reliability of mid-IR color-based methods to select blazar-like candidate counterparts of unassociated or unidentified γ-ray sources.
Key words: galaxies: active / BL Lacertae objects: general / quasars: emission lines / galaxies: luminosity function, mass function
Full Tables B.1 and B.2 are only available at the CDS via anonymous ftp to cdsarc.u-strasbg.fr (130.79.128.5) or via http://cdsarc.u-strasbg.fr/viz-bin/cat/J/A+A/643/A103
© ESO 2020
1. Introduction
With the launch in 2008 of the Fermi Large Area telescope (Fermi-LAT), a new era in γ-ray astronomy began (Atwood et al. 2009). One of the most challenging key scientific objectives of the Fermi-LAT mission1, highlighted prior to launch, is to determine “the type of object(s) and the mechanisms for gamma-ray emission from the unidentified gamma-ray sources” (Massaro et al. 2015a).
Among all associated γ-ray sources listed in the Fermi-LAT catalogs (1FGL, 2FGL, 3FGL, and 4FGL in Abdo et al. 2010; Nolan et al. 2012; Acero et al. 2015; Abdollahi et al. 2020, respectively), blazars constitute the largest known population (see also Mirabal & Halpern 2009; Hartman et al. 1999). In the most recent Fermi-LAT catalog (i.e., 4FGL), based on eight years of Fermi-LAT survey data, they form the vast majority of all associated sources (∼93%, or 3135 out of 3370 total). This statistic considered sources known as blazars of uncertain type (BCUs), which are blazars lacking a spectroscopic confirmation, and constituted more than 25% of the entire 4FGL.
Blazars are a subclass of radio-loud active galactic nuclei (AGNs), whose emission is interpreted as being due to relativistic particles accelerated in a collimated jet aligned within a few degrees of our line of sight (Blandford & Rees 1978). There are two main classes of blazars: BL Lac objects and flat spectrum radio quasars (FSRQs). The former are characterized by an almost featureless optical spectrum, or present only weak emission–absorption lines (with equivalent width, EW, less than 5 Å) mainly due to their host galaxy (Stickel et al. 1991; Stocke et al. 1991), making redshift (z) estimates challenging (see, e.g., Landoni et al. 2014, 2015a). On the other hand, the optical spectra of FSRQs appear to be typical of quasars (Stickel et al. 1991), but they additionally exhibit flat radio spectra and highly polarized emission from radio to optical frequencies (see, e.g., Healey et al. 2007; Hovatta et al. 2012).
Recent optical spectroscopic campaigns have found that the largest fraction of both potential low-energy counterparts of unidentified or unassociated γ-ray sources (UGSs) and classified BCUs are identified as BL Lacs (see, e.g., Landoni et al. 2015b; Massaro et al. 2016; Klindt et al. 2017; Marchesi et al. 2018; Desai et al. 2019; Paiano et al. 2019). These results strongly indicate that BL Lacs are the most elusive counterparts of γ-ray sources with respect to other extragalactic classes (D’Abrusco et al. 2013; Massaro et al. 2013a).
Discovering more BL Lacs among UGSs has immediate scientific return both in building their γ-ray luminosity function (see, e.g., Ajello et al. 2014), necessary to achieve a better understanding of the extragalactic γ-ray background (Ajello et al. 2015), and searching for signatures of attenuation in their γ-ray spectra by extragalactic background light (Domínguez et al. 2011; Ackermann et al. 2012a; Sandrinelli et al. 2013). The identification of UGSs is also useful in order to select potential targets for future observations with the Cherenkov Telescope Array (Massaro et al. 2013b; Arsioli et al. 2015), to obtain more stringent limits on dark matter annihilation in subhalos (Zechlin & Horns 2012; Berlin & Hooper 2014), to test new γ-ray detection algorithms (Abdollahi et al. 2020; Kerr 2019), and to search for new γ-ray source classes (Massaro et al. 2017; Bruni et al. 2018).
Over the past decade many approaches have been used to search for UGS counterparts. These methods are mainly based on radio observations at low frequencies (i.e., at or below ∼1 GHz; Massaro et al. 2013c; Nori et al. 2014; Giroletti et al. 2016; Mooney et al. 2019) and high frequencies (i.e., above 1 GHz; Hovatta et al. 2012; Petrov et al. 2013; Schinzel et al. 2015), or WISE (Wright et al. 2010) infrared (IR) data (Massaro et al. 2011; D’Abrusco et al. 2012; Massaro & D’Abrusco 2016), or X-ray follow-up campaigns (Masetti et al. 2010; Paggi et al. 2013; Stroh & Falcone 2013; Acero et al. 2013; Landi et al. 2015; Paiano et al. 2017a), as well as statistical algorithms (Ackermann et al. 2012b; Doert & Errando 2014; Salvetti et al. 2017) or optical polarimetry (Mandarakas et al. 2019; Liodakis & Blinov 2019). Among these, the most powerful tools are radio follow-up observations (Petrov et al. 2013; Nori et al. 2014; Schinzel et al. 2015; Giroletti et al. 2016; Schinzel et al. 2017) and statistical analysis of mid-IR colors (D’Abrusco et al. 2012; D’Abrusco et al. 2019). However, to ultimately confirm the blazar nature of the low-energy counterparts proposed in these studies, optical spectroscopic observations are strictly necessary (see, e.g., Massaro et al. 2016, for a recent review).
Thus, in 2014 we started a spectroscopic follow-up campaign, mainly based on observations carried out at 4 m class ground-based telescopes, to (i) confirm the blazar-like nature of candidate UGS counterparts selected on the basis of their mid-IR colors (Massaro et al. 2011, 2012a, 2013d; de Menezes et al. 2020a; ii) verify whether BCUs were blazars and classify them according to the possible presence (or lack) of features in their optical spectra, and (iii) observe any BL Lac whose redshift was still uncertain, aiming to observe them in a low-flux (i.e., quiescent) state (see, e.g., Álvarez Crespo et al. 2016a).
In the current paper we describe the overall impact of our optical campaign, carried out since 2014, highlighting the fraction of new associations and identifications obtained in each of the Fermi-LAT catalog releases. In our summary, we include the results of 30 newly acquired optical spectra of BCUs and potential low-energy counterparts of UGSs. We obtained the majority of the new spectra (22/30) in 2018 and 2019 using the Blanco and OAN-SPM telescopes, while we collected the remaining from an archival search of the Sloan Digital Sky Survey (SDSS) Data Release 15 (Aguado et al. 2019).
The manuscript is organized as follows. In Sect. 2 we briefly review the blazar classifications adopted during our campaign in comparison with those used in the Fermi-LAT catalogs. Then in Sect. 3 we present the results achieved for the 30 new optical spectra, with all the details on the data reduction and analysis and the images given in Appendix A. We discuss the overall impact of our optical spectroscopic campaigns on sources classified and associated in the Fermi-LAT catalogs in Sect. 4 (summary tables provided in Appendix B), including all the newly derived results from the spectra presented here. In Sect. 5 we compare the mid-IR-based classifications, mostly used to select targets during our spectroscopic campaign, with those determined by our optical spectroscopic observations. Finally, we present our summary, conclusions, and future perspectives in Sect. 6.
Given the large number of acronyms and abbreviations used in this paper, mostly due to different classifications and telescopes involved, we provide a summary in Table 1.
Acronyms and abbreviations used in the text.
2. Blazar classifications
Since we are comparing Fermi-LAT catalogs with sources that could be included in future releases of the Roma-BZCAT (Massaro et al. 2009, 2015b), it is necessary to describe how sources are classified in these catalogs and how they correspond.
For the results of our spectroscopic campaign we adopted the Roma-BZCAT nomenclature, where three types of sources are mainly distinguished:
-
BL Lac objects, labeled BZBs, are those sources with a featureless optical spectrum or that show a blue continuum with absorption lines due to the host galaxy, or that have weak and narrow emission lines with equivalent width of less than 5 Å;
-
Flat spectrum radio quasars, labeled BZQs, are characterized by optical spectra showing broad emission lines and non-thermal properties at other wavelengths (flat radio spectra indicating an optically thick jet and highly polarized emission from radio to optical);
-
BL Lac galaxy-dominated sources (BZGs), are sources usually reported as BL Lac objects in the literature, but whose spectral energy distributions are dominated by the host galaxy emission overwhelming the nuclear emission (Massaro et al. 2012b). All BZGs have a radio counterpart that, coupled with the blue excess in their optical spectra, indicate the likely presence of a jet in their nuclei, thus potentially being blazar-like sources. BZGs are not all expected to be genuine BZBs observed while their nuclei are in a quiescent state. Instead, some BZGs could be moderately bright AGNs, such as radio galaxies, with non-thermal emission that is not highly relativistically beamed.
In addition some objects observed during our spectroscopic campaign were simply indicated as “quasars,” labeled QSO, because the lack of additional multifrequency observations (e.g., presence of a flat radio spectrum) prevent us from firmly establishing their blazar nature. All sources classified as BZQs, BZGs, or labeled QSOs have a firm redshift measurement, while this is case-dependent in BZBs given their weak spectral features. The Fermi-LAT catalogs use a related set of labels that have evolved with their different releases, and the similarities and differences with our adopted Roma-BZCAT nomenclature are described here.
In the latest 4FGL release, BL Lac objects are indicated as BLLs, and flat spectrum radio quasar as FSRQ. The Fermi-LAT catalogs have a class named Blazar of Uncertain type (BCU) for sources that appear to share some blazar properties but lack an optical classification that confirms their nature. Additional sources are then indicated simply as AGNs in cases where their blazar-like nature is not formally established due to insufficient multifrequency observations. The 4FGL nomenclature was also adopted in the previous 3FGL.
However, it is worth noting that in the earlier 1FGL and 2FGL catalogs, γ-ray sources associated with a known BL Lac or a known FSRQ were indicated as BZB and BZQ, respectively, even if they were not part of Roma-BZCAT. These classifications were removed in the subsequent versions of the Fermi-LAT catalogs because of the confusion generated. Importantly, this implies that not all BZBs listed in both 1FGL and 2FGL respect the same classification criteria adopted in the Roma-BZCAT that we used during our spectroscopic campaign. This explains why the first two lines in Table 4 report the BZB/BLL label for the Fermi-LAT class of each catalog.
Thus all Roma-BZCAT sources classified as BZBs and BZQs are indicated, respectively, as BLLs and FSRQs in the Fermi-LAT catalog releases from the 3FGL onward. Additionally, the BCU classification was adopted starting with the 3FGL in place of AGNs of uncertain type (AGUs) used in both 1FGL and 2FGL; the class of AGNs remained unchanged through all the data releases. All details about the nomenclature adopted in the different Fermi-LAT catalogs can be found therein. A summary of the various classes used in the four Fermi-LAT data releases can be found in Table 6.
3. New optical spectra: sample selection and classification results
The strategy adopted during our optical spectroscopic campaign consists of observing small samples of targets in each run to minimize the impact on telescope schedules, and is mainly driven by visibility constraints.
The new spectra presented here were collected for targets selected from the following lists:
-
BCUs already assigned as counterparts to 4FGL catalog sources, but whose blazar nature were still uncertain;
-
radio and X-ray sources located within the γ-ray positional uncertainty of UGSs (Marchesini et al. 2020);
-
BL Lacs whose optical spectra are not available in the literature, or do not have a redshift estimate;
-
UGSs having a WISE source with blazar-like mid-IR colors lying within their positional uncertainty region, most of them being part of the WISE Blazar-like Radio-Loud Sources (WIBRaLS) and KDEBLLACS catalogs (D’Abrusco et al. 2019).
In particular, the WIBRaLS catalog sources have radio counterparts and were selected to all have mid-IR colors similar to those of Fermi-LAT detected blazars, while the KDEBLLACS catalog includes only BL Lac candidates selected using the kernel density estimation (KDE) technique in the WISE W2–W3 vs W1–W2 color-color diagram.
The current sample of 30 new targets includes the following:
-
Nineteen sources classified as BCUs in the 4FGL;
-
Three targets classified as UGSs in the preliminary version of the 4FGL (i.e., the FL8Y), all having a WISE blazar-like source lying within their γ-ray positional uncertainty region;
-
Seven BL Lacs and one FSRQ, with their classifications provided by us to the Fermi-LAT team during the preparation of the 4FGL catalog, thus appearing as such in the published 4FGL. Our sample also includes 4FGL J1704.5-0527 and 4FGL J2115.2+1218, two known BL Lacs in the literature; other groups published their spectra while our data analysis was in progress.
All our newly observed BCUs are now classified as BZBs, four of them resulting in redshift measurements, with the only exceptions of 4FGL J1640.9+1143 and 4FGL J1858.3+4321 that now appear to be BZGs. The three UGSs analyzed here all have a BZB lying within their γ-ray positional uncertainty region, with the one potentially associated with 4FGL J1637.5+3005 at z = 0.0786. All BL Lacs were confirmed as BZBs, two with redshift estimates (4FGL J1035.6+4409 at z = 0.4438 and 4FGL J1814.0+3828 at z = 0.2754), while one (FSRQ 4FGL J1459.5+1527) is a BZQ at z = 0.3711.
Table 2 reports all parameters and observational details about our selected sources. In Table 3 we show all the results achieved for our source sample, including emission–absorption lines detected, and resultant classifications; the figures with the new spectra are presented in Appendix A. We note that all targets classified as BZBs with undetermined redshifts are listed in Table 3 for completeness, but without entries for their spectral parameters.
Summary of the new optical spectra analyzed and presented in this paper.
Summary of the new optical spectra analyzed and presented in this paper.
4. Impact of optical spectroscopic observations on the Fermi-LAT source catalogs
Here we summarize all the results achieved to date, distinguishing those obtained thanks to our optical spectroscopic campaign from those found in the literature. Our summary is presented separating each Fermi-LAT catalog release available to date to highlight the evolution of the impact of our campaign on Fermi-LAT associations. However, this also implies that sources listed in more than one Fermi-LAT catalog are counted in each of them.
In Appendix B we report both summary lists including all details obtained thanks to our observations as well as those found in the literature search. We note that sources spectroscopically identified during our follow-up campaign and those found in the literature reported in different versions of the Fermi-LAT catalogs are not independent.
4.1. Optical spectroscopic campaigns
During our optical spectroscopic campaigns we analyzed 441 observations and we found 394 optical spectra that allowed us to clearly classify the targets; this is our “clean” sample reported in Appendix A. These spectra include those found in the SDSS and 6dF databases and analyzed as part of our campaign.
For the 47 optical spectra not used, 27 observations revealed an “incorrect” target (e.g., a star lying within the positional uncertainty region of a UGS), while an additional seven spectra achieved only low signal-to-noise ratios (S/N), thus were not reported in our summary table presented here. The remaining 13 cases were targets observed with more than one telescope.
In our clean sample, 237 sources out of 394 were previously unclassified and had no optical spectrum present in the literature. We observed 306 targets with ground-based telescopes, while 88 spectra were collected from archival SDSS and 6dF observations. In the clean sample, 121 of them lie in the northern hemisphere while the remaining 116 in the southern. Our most widely used facilities were OAN-SPM in the northern hemisphere and SOAR telescope at southern declinations.
During our campaign we also observed a total of 128 Roma-BZCAT sources, mostly BL Lac candidates or sources of uncertain classification or lacking a z estimate, in order to provide updated information in the next release of the blazar catalog. There are also 59 targets that were analyzed in other papers, while we were carrying out our campaign.
Results on the impact of our optical spectroscopic observations, carried out since the first release of the Fermi-LAT source catalog, on the association of γ-ray sources listed therein are all summarized as follows. In Table 4 we report the number of Fermi-LAT sources observed in each catalog as classified therein. For example in the 2FGL we analyzed 76 spectra of sources listed as AGN or AGU.
Gamma-ray classification of targets observed during our spectroscopic campaign as reported in each Fermi-LAT catalog.
Table 5 summarizes the fraction of uncertain sources (BCUs and UGSs in the 3FGL or similar in the other catalogs), for which we provide a firm optical classification with respect to the total number reported in the original Fermi-LAT catalog. Since we started our campaign after the 2FGL release and during the 3FGL preparation, the impact of our observations was larger on these two catalogs. In particular, we were able to classify ∼25% of the uncertain AGNs and found potential blazar-like low-energy counterparts for 9% and 6% of UGSs listed therein.
Fractions of Fermi-LAT sources of uncertain nature (i.e., AGUs, BCUs, and UGSs) analyzed during our campaign and computed with respect to the total number in each Fermi-LAT catalog.
In Table 6 we show for each sample of sources listed in all Fermi-LAT catalogs the classifications we obtained. For example in the 3FGL we observed 103 sources listed therein as AGNs or BCUs, but whose optical spectra clearly indicate them to be BL Lacs. Moreover, as reported in parentheses in the BZB column, 20 of these 103 targets also have a firm redshift measurement. We classified an additional 14 AGNs or BCUs from the 3FGL as BZQ, plus 7 more simply as “quasars” since they lack radio spectral information, thus the entry is reported as 14[+7] in Table 6. Finally, 15 more AGNs or BCUs from the 3FGL were classified as BZGs, all with a firm z measurement, contributing to the total of 139 sources indicated in Table 4.
Classification results achieved thanks to our optical spectroscopic campaign split with respect to sources listed in each Fermi-LAT catalog.
Finally, Fig. 1 shows the cumulative distributions of all confirmed blazars observed during our spectroscopic campaign in each published paper. Sources classified as BZBs and BZQs are indicated separately, and we further distinguished between those observed by us and those discovered thanks to archival searches in major surveys (e.g., SDSS and 6dF).
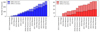 |
Fig. 1. Cumulative distributions of all sources observed during our spectroscopic campaign (solid bars) and classified as BZBs (left panel in blue) or BZQs (right panel in red) in addition to those found in our archival searches of other spectroscopic surveys (hatched bars). |
4.2. Literature search
During our optical spectroscopic campaign, other teams worldwide were presenting optical spectra of sources listed in the Fermi-LAT catalogs as UGSs or BCUs. Thus, we continuously kept track of these works to avoid duplicating targets, and provided our summaries of the literature results to our Fermi-LAT collaboration colleagues while they were preparing each new release of the γ-ray source catalogs. Thus, in this work we report all information retrieved from the literature from that timespan that met the same criteria adopted to classify sources in our campaign and those of the Roma-BZCAT.
In the literature we found a total of 123 sources, with 67 objects in the northern hemisphere and 56 in the southern. These observations include 23 known blazars listed in the latest release of the Roma-BZCAT and 19 targets collected from data available in the SDSS or 6dF surveys.
Following Table 4 from the previous section, Table 7 provides all information from the literature on the total number of sources analyzed for each Fermi-LAT catalog since the 1FGL release. It is evident that most of the efforts reported in the literature were focused on 3FGL sources; most observational campaigns carried out in parallel with our work started later, with the main exception being the observations performed by Shaw et al. (2013).
Gamma-ray classification of sources analyzed in the literature as reported in each Fermi-LAT catalog.
In Table 8 we show for each sample of sources listed in all Fermi-LAT catalogs the classification reported in the literature. For the literature results we did not report the comparison with the FL8Y, the intermediate catalog between the 3FGL and the 4FGL, because most of our efforts were focused on 3FGL sources quite close to the time of the FL8Y release. Nevertheless, during our optical spectroscopic campaign we observed some sources listed only in the FL8Y catalog, and all sources found in the literature belong to one of the major releases (3FGL or 4FGL) and thus the comparison with FL8Y it is not relevant.
Classification results collected from the literature distinguishing sources belonging to each Fermi-LAT catalog.
5. Comparing mid-IR color predictions with optical campaign and literature results
In this section we present the comparison between the predicted classifications based on mid-IR colors with those ultimately provided by optical spectroscopic observations, distinguishing between sources collected during our campaign and those found in the literature.
We classified sources based on the Ca II break feature in the optical spectra. The break is defined as C = (F+ − F−)/F+, with F+ and F− being the fluxes measured respectively at rest-frame wavelengths of 3750–3950 Å and 4050–4250 Å (Landt et al. 2002). The division line for BZGs is C ≥ 0.25; otherwise, they are classified as BZB.
A large fraction of targets selected for our optical spectroscopic observations was based on the statistical analysis of mid-IR colors as presented in the WIBRaLS catalog (D’Abrusco et al. 2014), for which the second version, WIBRaLS2, has been recently released together with the KDEBLLACS (D’Abrusco et al. 2019). The main descriptions of these two catalogs are summarized below:
-
The WIBRaLS2 catalog contains 9541 candidate blazars, selected from WISE sources detected in all four W1, W2, W3, and W4 filters (3.4, 4.6, 12, and 22 μm, respectively), and whose colors are similar to those of confirmed γ-ray emitting blazars. As shown in our previous analyses (D’Abrusco et al. 2014; D’Abrusco et al. 2019; Massaro et al. 2016), Galactic extinction affects only the W1 band for sources lying at low Galactic latitudes (|b|< 20°) at levels of only 2−5% of the magnitude, thus the WISE magnitudes were not corrected for extinction. The selection is performed in the three-dimensional principal component (PC) space generated by the distribution of W1–W2, W2–W3, and W3–W4 colors for a sample of bona fide γ-ray blazars (the locus). Differently from the direct color space, in the PC space the region occupied by the locus can be modeled with coaxial cylinders. This method also distinguishes among BZB-like, BZQ-like, or MIXED candidates based on the WISE colors, hereafter labeled as WBZB, WBZQ, and MIXED types, respectively. The MIXED-type sources have colors consistent with both blazar classes. WISE-selected sources are further required to have a radio counterpart that is determined to be radio-loud (according to the q22 parameter; see below).
-
The KDEBLLACS catalog includes 5579 BL Lac candidates selected from WISE sources that are not detected in the W4 band. The colors of these candidates lie within the region of the W1–W2 versus W2–W3 color-color diagram occupied by a set of confirmed BL Lacs with WISE counterparts not detected in W4. The region of the color-color plane used for the selection is defined as the area enclosed by the 5% contour of the 2D density distribution of the confirmed BLLacs, determined using the KDE method. As for the WIBRaLS, the final members of the KDEBLLACS catalog are selected to have a radio-loud counterpart (according to the q12 parameter; see below).
Both the q22 and q12 parameters are simply modified definitions of the so-called q parameter (Helou et al. 1985), defined as the logarithm of the ratio of far-IR to radio flux densities (Sradio). Applied to the WISE flux densities in the W4 (S22 μm) and W3 (S12 μm) bands, the definitions of radio-loudness were q22 = log(S22 μm/Sradio) for WIBRaLS and q12 = log(S12 μm/Sradio) for KDEBLLACS.
Comparing our 394 sources with those listed in WIBRaLS we found 212 total matches, consisting of 178 WBZBs, 22 WBZQs, and 12 MIXED. In Table 9, we report how they were classified based on our spectroscopic observations. In this table we adopted the same nomenclature used in Table 6 to indicate those targets classified as quasars but lacking radio spectral information and thus not qualified to be BZQ according to our criteria. We also present in Fig. 2 the projections of the three WISE color-color planes, for the sources in this work that have a WIBRaLS counterpart.
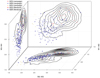 |
Fig. 2. Projections on the three WISE color-color planes of spectroscopically identified sources discussed in this paper with counterparts in WIBRaLS. Red, blue, and yellow points respectively indicate candidates classified as BZQ, BZB, and BZG sources based on their optical spectra. Circles and stars are associated with sources observed in this campaign and sources for which spectra are available in the literature, respectively. The black lines on the three planes are the isodensity contours of the 2D projections of the 3D color distribution of locus sources (not plotted for clarity) used to define the WIBRaLS 3D model in the WISE colors space. |
Comparison between the expected classification provided in WIBRaLS2 catalog with those obtained in our optical spectroscopic campaign.
Overall we found that only 8 out of 212 WIBRaLS2 sources are classified as quasars. We confirmed the nature of 161 out of 178 (90%) of those targets expected to be BZBs, and ∼70% of the WBZQs and the largest fraction of those indicated as MIXED in WIBRaLS2 are BZBs. It is worth noting that only 12 sources out of 212 are classified as BZGs and they were all expected to be BZBs according to their mid-IR colors in WIBRaLS2.
On the other hand, only 43 spectroscopic identifications were achieved out of 394 sources selected from the KDEBLLACS catalog. In all these cases, they were expected to be BZBs based on the mid-IR colors, and the spectroscopic observations confirmed 40 as BZBs; only three were better classified as BZGs.
This comparison strongly supports both the reliability of methods based on mid-IR colors to select candidate counterparts for UGSs and that there is a high chance to confirm the blazar-like nature of BCUs and that they are most likely classified as BZBs. Similar conclusions could be drawn for the literature results where we compared WIBRaLS2 with sources analyzed by other groups and found 37 matches out of 123 targets (see Table 10). All WIBRaLS2 sources were confirmed as BZBs with only one exception, 3FGL J0644.3-6713, which is a BZQ. In the KDEBLLACS catalog, we found 35 out of 123 sources listed among those classified in the literature, and again all of them are BZBs.
Comparison between the expected classification provided in WIBRaLS2 catalog with those obtained in our literature search.
6. Summary and conclusions
In this work we summarized all the results achieved to date thanks to the optical spectroscopic campaign we carried out to reveal the nature of Fermi-LAT sources classified as BCUs and to potentially identify blazar-like sources lying within the positional uncertainty regions of UGSs.
Since the beginning of our campaign in 2014 we analyzed 394 unique targets confirming the blazar-like nature of 371. We classified 300 BZBs (38 with a firm redshift measurement), 40 BZQs, and 31 BZGs. Additionally, there are 23 sources for which the lack of radio spectral information prevented us from labeling them as BZQs, and thus are simply indicated as quasars.
Altogether, we observed 122 targets in the northern hemisphere mostly thanks to the OAN-SPM facility and 116 targets in the southern hemisphere predominantly through observations with the SOAR telescope. We observed 306 targets out of 394 using ground-based telescopes, while 88 spectra were collected from archival observations from large spectroscopic surveys. The selection of our targets was mainly based on mid-IR colors since 212 out of 394 also belong to the WIBRaLS2 catalog and 43 to the KDEBLLACS (D’Abrusco et al. 2019); the expected blazar classification reported therein was mainly confirmed by our follow-up observations. These results also include 30 new spectra presented in this paper, for which all details on the data reduction and analysis are available in Appendix A.
Here we also described results found in an extensive literature search carried out in parallel with our campaign to avoid observing targets already classified by other groups. From these literature results we found a total of 123 sources, 67 lying in the northern hemisphere and 56 in the southern. These observations resulted in one BZG, four BZQs, and one quasar, while all the remaining sources were classified as BZBs (34 with firm redshift measurements). Of these 123 sources, only in 19 cases were spectra analyzed from archival observations available thanks to spectroscopic surveys. A significant fraction of them (∼59%) also have a mid-IR counterpart in one of the two main catalogs used to select targets for our campaign, namely 37 in WIBRaLS2 and 35 in KDEBLLACS. All these sources are classified as BZBs with only one exception, thus mainly confirming the expected classification reported therein based on WISE colors.
Finally, we conclude that ∼20% of blazars currently listed in the 4FGL are classified thanks to our optical spectroscopic campaign and additional ∼7% arise from literature results. Moreover the largest fraction of them are BL Lac objects, thus confirming that this is the most elusive class of extragalactic γ-ray sources.
Our observational campaign is still ongoing, and while preparing this paper, an additional 62 spectra have been already collected. Considering new observing runs already awarded to our group and considering our efficiency in acquiring spectra to date, we expect to release results for an additional ∼500 targets by around 2022.
Acknowledgments
H. P.-H. and R. A.-A. acknowledge support from CONACyT program for Ph.D. studies. This work was partially supported from CONACyT research Grant No. 280789. Based upon observations acquired at the Observatorio Astronómico Nacional San Pedro Mártir (OAN-SPM), Baja California, México. This work is based on data acquired at Blanco CTIO telescope. We thank the staff at the OAN-SPM and Blanco CTIO telescope for all their help during the observation runs. F. R. acknowledges support from FONDECYT Postdoctorado 3180506 and CONICYT project Basal AFB-170002. The work of R. M. is supported by FAPESP (Fundação de Amparo à Pesquisa do Estado de São Paulo) under grants 2016/25484-9, 2018/24801-6. Work by C. C. C. at the Naval Research Laboratory is supported by the Office of Naval Research 6.1. This work is supported by the “Departments of Excellence 2018–2022 Grant awarded by the Italian Ministry of Education, University and Research (MIUR) (L. 232/2016). This research has made use of resources provided by the Compagnia di San Paolo for the grant awarded on the BLENV project (S1618_L1_MASF_01) and by the Ministry of Education, Universities and Research for the grant MASF_FFABR_17_01. A.P. acknowledges financial support from the Consorzio Interuniversitario per la Fisica Spaziale (CIFS) under the agreement related to the grant MASF_CONTR_FIN_18_02. This publication makes use of data products from the Wide-field Infrared Survey Explorer, which is a joint project of the University of California, Los Angeles, and the Jet Propulsion Laboratory/California Institute of Technology, funded by the National Aeronautics and Space Administration. Funding for the Sloan Digital Sky Survey IV has been provided by the Alfred P. Sloan Foundation, the US Department of Energy Office of Science, and the Participating Institutions. SDSS-IV acknowledges support and resources from the Center for High Performance Computing at the University of Utah. The SDSS web site is www.sdss.org. SDSS-IV is managed by the Astrophysical Research Consortium for the Participating Institutions of the SDSS Collaboration including the Brazilian Participation Group, the Carnegie Institution for Science, Carnegie Mellon University, the Chilean Participation Group, the French Participation Group, Harvard-Smithsonian Center for Astrophysics, Instituto de Astrofísica de Canarias, The Johns Hopkins University, Kavli Institute for the Physics and Mathematics of the Universe (IPMU)/University of Tokyo, the Korean Participation Group, Lawrence Berkeley National Laboratory, Leibniz Institut für Astrophysik Potsdam (AIP), Max-Planck-Institut für Astronomie (MPIA Heidelberg), Max-Planck-Institut für Astrophysik (MPA Garching), Max-Planck-Institut für Extraterrestrische Physik (MPE), National Astronomical Observatories of China, New Mexico State University, New York University, University of Notre Dame, Observatório Nacional/MCTI, The Ohio State University, Pennsylvania State University, Shanghai Astronomical Observatory, United Kingdom Participation Group, Universidad Nacional Autóoma de México, University of Arizona, University of Colorado Boulder, University of Oxford, University of Portsmouth, University of Utah, University of Virginia, University of Washington, University of Wisconsin, Vanderbilt University, and Yale University. TOPCAT8 (Taylor 2005) was extensively used in this work for the preparation and manipulation of the tabular data.
References
- Abdo, A. A., Ackermann, M., Ajello, M., et al. 2010, ApJS, 188, 405 [NASA ADS] [CrossRef] [Google Scholar]
- Abdollahi, S., Acero, F., Ackermann, M., et al. 2020, ApJS, 247, 33 [NASA ADS] [CrossRef] [Google Scholar]
- Acero, F., Donato, D., Ojha, R., et al. 2013, ApJ, 779, 133 [NASA ADS] [CrossRef] [Google Scholar]
- Acero, F., Ackermann, M., Ajello, M., et al. 2015, ApJS, 218, 23 [Google Scholar]
- Ackermann, M., Ajello, M., Allafort, A., et al. 2012a, ApJ, 753, 83 [NASA ADS] [CrossRef] [Google Scholar]
- Ackermann, M., Ajello, M., Allafort, A., et al. 2012b, Science, 338, 1190 [NASA ADS] [CrossRef] [Google Scholar]
- Aguado, D. S., Ahumada, R., Almeida, A., et al. 2019, ApJS, 240, 23 [NASA ADS] [CrossRef] [Google Scholar]
- Ajello, M., Romani, R. W., Gasparrini, D., et al. 2014, ApJ, 780, 73 [NASA ADS] [CrossRef] [Google Scholar]
- Ajello, M., Gasparrini, D., Sánchez-Conde, M., et al. 2015, ApJ, 800, L27 [NASA ADS] [CrossRef] [Google Scholar]
- Álvarez Crespo, N., Masetti, N., Landoni, M., et al. 2016a, AJ, 151, 32 [NASA ADS] [CrossRef] [Google Scholar]
- Álvarez Crespo, N., Massaro, F., Milisavljevic, D., et al. 2016b, AJ, 151, 95 [NASA ADS] [CrossRef] [Google Scholar]
- Álvarez-Crespo, N., Massaro, F., D’Abrusco, R., et al. 2016c, Ap&SS, 361, 316 [NASA ADS] [CrossRef] [Google Scholar]
- Arsioli, B., Fraga, B., Giommi, P., et al. 2015, A&A, 579, A34 [NASA ADS] [CrossRef] [EDP Sciences] [Google Scholar]
- Atwood, W. B., Abdo, A. A., Ackermann, M., et al. 2009, ApJ, 697, 1071 [NASA ADS] [CrossRef] [Google Scholar]
- Berlin, A., & Hooper, D. 2014, Phys. Rev. D, 89, 016014 [CrossRef] [Google Scholar]
- Blandford, R. D., & Rees, M. J. 1978, Proc. Pittsburgh Conference on BL Lac Objects (Pittsburgh: University of Pittsburgh), 328 [Google Scholar]
- Britzen, S., Brinkmann, W., Campbell, R. M., et al. 2007, A&A, 476, 759 [NASA ADS] [CrossRef] [EDP Sciences] [Google Scholar]
- Bruni, G., Panessa, F., Ghisellini, G., et al. 2018, ApJ, 854, L23 [NASA ADS] [CrossRef] [Google Scholar]
- Caccianiga, A., Marchã, M. J., Antón, S., et al. 2002, MNRAS, 329, 877 [NASA ADS] [CrossRef] [Google Scholar]
- Cowperthwaite, P. S., Massaro, F., D’Abrusco, R., et al. 2013, AJ, 146, 110 [CrossRef] [Google Scholar]
- D’Abrusco, R., Massaro, F., Ajello, M., et al. 2012, ApJ, 748, 68 [NASA ADS] [CrossRef] [Google Scholar]
- D’Abrusco, R., Massaro, F., Paggi, A., et al. 2013, ApJS, 206, 12 [NASA ADS] [CrossRef] [Google Scholar]
- D’Abrusco, R., Massaro, F., Paggi, A., et al. 2014, ApJS, 215, 14 [NASA ADS] [CrossRef] [Google Scholar]
- D’Abrusco, R., Álvarez Crespo, N., Massaro, F., et al. 2019, ApJS, 242, 4 [NASA ADS] [CrossRef] [Google Scholar]
- de Menezes, R., Peña-Herazo, H. A., Marchesini, E. J., et al. 2019, A&A, 630, A55 [CrossRef] [EDP Sciences] [Google Scholar]
- de Menezes, R., Amaya-Almazán, R. A., Marchesini, E. J., et al. 2020a, Ap&SS, 365, 12 [CrossRef] [Google Scholar]
- de Menezes, R., D’Abrusco, R., Massaro, F., et al. 2020b, ApJS, 248, 23 [CrossRef] [Google Scholar]
- Desai, A., Marchesi, S., Rajagopal, M., et al. 2019, ApJS, 241, 5 [CrossRef] [Google Scholar]
- Doert, M., & Errando, M. 2014, ApJ, 782, 41 [NASA ADS] [CrossRef] [Google Scholar]
- Domínguez, A., Primack, J. R., Rosario, D. J., et al. 2011, MNRAS, 410, 2556 [NASA ADS] [CrossRef] [Google Scholar]
- Falco, E. E., Kochanek, C. S., & Muñoz, J. A. 1998, ApJ, 494, 47 [NASA ADS] [CrossRef] [Google Scholar]
- Giroletti, M., Massaro, F., D’Abrusco, R., et al. 2016, A&A, 588, A141 [NASA ADS] [CrossRef] [EDP Sciences] [Google Scholar]
- Hartman, R. C., Bertsch, D. L., Bloom, S. D., et al. 1999, ApJS, 123, 79 [NASA ADS] [CrossRef] [Google Scholar]
- Healey, S. E., Romani, R. W., Taylor, G. B., et al. 2007, ApJS, 171, 61 [NASA ADS] [CrossRef] [Google Scholar]
- Helou, G., Soifer, B. T., & Rowan-Robinson, M. 1985, ApJ, 298, L7 [Google Scholar]
- Hewitt, A., & Burbidge, G. 1980, ApJS, 43, 57 [NASA ADS] [CrossRef] [Google Scholar]
- Hovatta, T., Lister, M. L., Aller, M. F., et al. 2012, AJ, 144, 105 [NASA ADS] [CrossRef] [Google Scholar]
- Jones, D. H., Read, M. A., Saunders, W., et al. 2009, MNRAS, 399, 683 [NASA ADS] [CrossRef] [Google Scholar]
- Kerr, M. 2019, ApJ, 885, 92 [CrossRef] [Google Scholar]
- Klindt, L., van Soelen, B., Meintjes, P. J., et al. 2017, MNRAS, 467, 2537 [Google Scholar]
- La Mura, G., Busetto, G., Ciroi, S., et al. 2017, Eur. Phys. J. D, 71, 95 [CrossRef] [EDP Sciences] [Google Scholar]
- Landi, R., Bassani, L., Stephen, J. B., et al. 2015, A&A, 581, 57 [NASA ADS] [CrossRef] [EDP Sciences] [Google Scholar]
- Landt, H., Padovani, P., & Giommi, P. 2002, MNRAS, 336, 945 [NASA ADS] [CrossRef] [Google Scholar]
- Landoni, M., Falomo, R., Treves, A., et al. 2014, A&A, 570, A126 [NASA ADS] [CrossRef] [EDP Sciences] [Google Scholar]
- Landoni, M., Massaro, F., Paggi, A., et al. 2015a, AJ, 149, 163 [NASA ADS] [CrossRef] [Google Scholar]
- Landoni, M., Falomo, R., Treves, A., et al. 2015b, AJ, 150, 181 [NASA ADS] [CrossRef] [Google Scholar]
- Landoni, M., Paiano, S., Falomo, R., et al. 2018, ApJ, 861, 130 [CrossRef] [Google Scholar]
- Liodakis, I., & Blinov, D. 2019, MNRAS, 486, 3415 [CrossRef] [Google Scholar]
- Marchesi, S., Kaur, A., & Ajello, M. 2018, AJ, 156, 212 [CrossRef] [Google Scholar]
- Marchesini, E. J., Masetti, N., Chavushyan, V., et al. 2016, A&A, 596, A10 [NASA ADS] [CrossRef] [EDP Sciences] [Google Scholar]
- Marchesini, E. J., Peña-Herazo, H. A., Álvarez Crespo, N., et al. 2019, Ap&SS, 364, 5 [NASA ADS] [CrossRef] [Google Scholar]
- Marchesini, E. J., Paggi, A., Massaro, F., et al. 2020, A&A, 638, A128 [CrossRef] [EDP Sciences] [Google Scholar]
- Mandarakas, N., Blinov, D., Liodakis, I., et al. 2019, A&A, 623, A61 [CrossRef] [EDP Sciences] [Google Scholar]
- Marlow, D. R., Rusin, D., Jackson, N., et al. 2000, AJ, 119, 2629 [NASA ADS] [CrossRef] [Google Scholar]
- Martí, J., Paredes, J. M., Bloom, J. S., et al. 2004, A&A, 413, 309 [NASA ADS] [CrossRef] [EDP Sciences] [Google Scholar]
- Masetti, N., Parisi, P., Palazzi, E., et al. 2010, A&A, 519, A96 [NASA ADS] [CrossRef] [EDP Sciences] [Google Scholar]
- Masetti, N., Parisi, P., Palazzi, E., et al. 2013, A&A, 556, A120 [NASA ADS] [CrossRef] [EDP Sciences] [Google Scholar]
- Massaro, E., Giommi, P., Leto, C., et al. 2009, A&A, 495, 691 [NASA ADS] [CrossRef] [EDP Sciences] [Google Scholar]
- Massaro, F., & D’Abrusco, R. 2016, ApJ, 827, 67 [NASA ADS] [CrossRef] [Google Scholar]
- Massaro, F., D’Abrusco, R., Ajello, M., et al. 2011, ApJ, 740, L48 [NASA ADS] [CrossRef] [Google Scholar]
- Massaro, E., Nesci, R., & Piranomonte, S. 2012a, MNRAS, 422, 2322 [NASA ADS] [CrossRef] [Google Scholar]
- Massaro, F., D’Abrusco, R., Tosti, G., et al. 2012b, ApJ, 750, 138 [NASA ADS] [CrossRef] [Google Scholar]
- Massaro, F., D’Abrusco, R., Giroletti, M., et al. 2013a, ApJS, 207, 4 [NASA ADS] [CrossRef] [Google Scholar]
- Massaro, F., Paggi, A., Errando, M., et al. 2013b, ApJS, 207, 16 [NASA ADS] [CrossRef] [Google Scholar]
- Massaro, F., D’Abrusco, R., Paggi, A., et al. 2013c, ApJS, 209, 10 [NASA ADS] [CrossRef] [Google Scholar]
- Massaro, F., D’Abrusco, R., Paggi, A., et al. 2013d, ApJS, 206, 13 [NASA ADS] [CrossRef] [Google Scholar]
- Massaro, F., Masetti, N., D’Abrusco, R., et al. 2014, AJ, 148, 66 [NASA ADS] [CrossRef] [Google Scholar]
- Massaro, F., Thompson, D. J., & Ferrara, E. C. 2015a, A&ARv, 24, 2 [NASA ADS] [CrossRef] [Google Scholar]
- Massaro, E., Maselli, A., Leto, C., et al. 2015b, Ap&SS, 357, 75 [NASA ADS] [CrossRef] [Google Scholar]
- Massaro, F., Landoni, M., D’Abrusco, R., et al. 2015c, A&A, 575, 124 [Google Scholar]
- Massaro, F., D’Abrusco, R., Landoni, M., et al. 2015d, ApJS, 217, 2 [NASA ADS] [CrossRef] [Google Scholar]
- Massaro, F., Álvarez Crespo, N., D’Abrusco, R., et al. 2016, Ap&SS, 361, 337 [NASA ADS] [CrossRef] [Google Scholar]
- Massaro, F., Marchesini, E. J., D’Abrusco, R., et al. 2017, ApJ, 834, 113 [NASA ADS] [CrossRef] [Google Scholar]
- Mirabal, N., & Halpern, J. P. 2009, ApJ, 701, 129 [NASA ADS] [CrossRef] [Google Scholar]
- Mooney, S., Quinn, J., Callingham, J. R., et al. 2019, A&A, 714, A14 [NASA ADS] [CrossRef] [EDP Sciences] [Google Scholar]
- Nolan, P. L., Abdo, A. A., Ackermann, M., et al. 2012, ApJS, 199, 31 [NASA ADS] [CrossRef] [Google Scholar]
- Nori, M., Giroletti, M., Massaro, F., et al. 2014, ApJS, 212, 3 [NASA ADS] [CrossRef] [Google Scholar]
- Paggi, A., Massaro, F., D’Abrusco, R., et al. 2013, ApJS, 209, 9 [NASA ADS] [CrossRef] [Google Scholar]
- Paggi, A., Milisavljevic, D., Masetti, N., et al. 2014, AJ, 147, 112 [NASA ADS] [CrossRef] [Google Scholar]
- Paiano, S., Falomo, R., Franceschini, A., et al. 2017a, ApJ, 851, 135 [CrossRef] [Google Scholar]
- Paiano, S., Landoni, M., Falomo, R., et al. 2017b, ApJ, 844, 120 [CrossRef] [Google Scholar]
- Paiano, S., Falomo, R., Treves, A., et al. 2019, ApJ, 871, 162 [CrossRef] [Google Scholar]
- Peña-Herazo, H. A., Marchesini, E. J., Álvarez Crespo, N., et al. 2017, Ap&SS, 362, 228 [NASA ADS] [CrossRef] [Google Scholar]
- Peña-Herazo, H. A., Massaro, F., Chavushyan, V., et al. 2019, Ap&SS, 364, 85 [NASA ADS] [CrossRef] [Google Scholar]
- Peterson, B. A., Jauncey, D. J., Wright, A. E., et al. 1976, ApJ, 207, L5 [NASA ADS] [CrossRef] [Google Scholar]
- Petrov, L., Mahony, E. K., Edwards, P. G., et al. 2013, MNRAS, 432, 1294 [NASA ADS] [CrossRef] [Google Scholar]
- Ricci, F., Massaro, F., Landoni, M., et al. 2015, AJ, 149, 160 [Google Scholar]
- Salvetti, D., Chiaro, G., La Mura, G., et al. 2017, MNRAS, 470, 1291 [NASA ADS] [CrossRef] [Google Scholar]
- Sandrinelli, A., Treves, A., Falomo, R., et al. 2013, AJ, 146, 163 [CrossRef] [Google Scholar]
- Schinzel, F. K., Petrov, L., & Taylor, G. B. 2015, ApJS, 217, 4 [NASA ADS] [CrossRef] [Google Scholar]
- Schinzel, F. K., Petrov, L., Taylor, G. B., et al. 2017, ApJ, 838, 139 [NASA ADS] [CrossRef] [Google Scholar]
- Schlegel, D. J., & Finkbeiner, D. P. 1998, ApJ, 500, 525S [NASA ADS] [CrossRef] [Google Scholar]
- Shaw, M. S., Romani, R. W., Cotter, G., et al. 2013, ApJ, 764, 135 [NASA ADS] [CrossRef] [Google Scholar]
- Stickel, M., Padovani, P., Urry, C. M., et al. 1991, ApJ, 374, 431 [Google Scholar]
- Stocke, J. T., Morris, S. L., Gioia, I. M., et al. 1991, ApJS, 76, 813 [Google Scholar]
- Stroh, M. C., & Falcone, A. D. 2013, ApJS, 207, 28 [NASA ADS] [CrossRef] [Google Scholar]
- Taylor, M. B. 2005, ASP Conf. Ser., 347, 29 [Google Scholar]
- Titov, O., Stanford, L. M., Johnston, H. M., et al. 2013, AJ, 146, 10 [NASA ADS] [CrossRef] [Google Scholar]
- Tody, D. 1986, SPIE, 627, 733 [Google Scholar]
- Tody, D. 1993, in Astronomical Data Analysis Software and Systems II, eds. R. J. Hanisch, R. J. V. Brissenden, & J. Barnes (San Francisco: ASP), ASP Conf. Ser., 52, 173 [Google Scholar]
- Tsarevsky, G., de Freitas Pacheco, J. A., Kardashev, N., et al. 2005, A&A, 438, 949 [NASA ADS] [CrossRef] [EDP Sciences] [Google Scholar]
- van Dokkum, P. G. 2001, PASP, 113, 1420 [NASA ADS] [CrossRef] [Google Scholar]
- Vermeulen, R. C., & Taylor, G. B. 1995, AJ, 109, 1983 [NASA ADS] [CrossRef] [Google Scholar]
- Wright, E. L., Eisenhardt, P. R. M., Mainzer, A. K., et al. 2010, AJ, 140, 1868 [Google Scholar]
- Wisotzki, L., Christlieb, N., Bade, N., et al. 2000, A&A, 358, 77 [NASA ADS] [Google Scholar]
- Zechlin, H., & Horns, D. 2012, JCAP, 11, 050 [CrossRef] [Google Scholar]
Appendix A: Data reduction and analysis of new spectroscopic observations
This appendix describes in more detail the results for the 30 sources analyzed in this paper (see Sect. 3). The results were derived from new observations with the Blanco and OAN-SPM telescopes and from archival data collected from the SDSS.
Our targets were selected from the KDEBLLACS and WIBRALS2 catalogs (D’Abrusco et al. 2019), a sample of X-ray selected sources (Marchesini et al. 2020), and BL Lac objects with previously undetermined redshifts that would benefit from new observations. In our sample 7 sources were observed at Blanco (2 UGSs, 5 BCUs), 15 at OAN-SPM (6 UGSs, 9 BCUs), while the remaining 8 (all 5 BL Lacs, 1 UGS, and 2 BCU) were found in the SDSS DR15 archive (Aguado et al. 2019). We provided the spectroscopic classifications of these five BL Lacs to the Fermi-LAT team during the preparation of the 4FGL catalog release which is why they were already classified therein.
As in previous analyses from our spectroscopic campaign (e.g., Peña-Herazo et al. 2017; Marchesini et al. 2019), all spectroscopic data sets acquired were optimally extracted and reduced following standard procedures with IRAF (Tody 1986, 1993). Thus, here we provide only a brief overview of the data acquisition and our extraction procedure of the optical spectra (see Marchesini et al. 2019 for details). Details of the Blanco telescope observations are provided below as this was the first time it was used in our campaign. Further details regarding the OAN-SPM observations are given in our past papers (Masetti et al. 2013; Massaro et al. 2015c). We describe the selection of the SDSS spectra and our results from tthe measurements that utilized the DR15 pipeline-calibrated spectra.
All spectra are de-reddened for Galactic absorption assuming E(B − V) values from the relation presented by Schlegel & Finkbeiner (1998). Although the main scientific objective of our campaign does not require a precise flux calibration, we derived relative photometry by observing a spectrophotometric standard star during each night of the different observing runs. To detect faint spectral features, aimed at estimating redshifts, we also present normalized spectra.
All the following figures showing the new spectra are in the same format adopted in our previous analyses. We claim a line identification whenever there are at least two absorption and/or emission lines present that can be identified with a redshift value. As in our previous analyses (see, e.g., Masetti et al. 2013; Marchesini et al. 2019), these spectral features must be detected in more than one exposure.
A.1. Victor Blanco Telescope
Southern declination sources (i.e., at Dec < 0°) were observed in visiting mode at the Victor Blanco 4 m telescope in Cerro Tololo, Chile on 2019 June 12. We made use of the COSMOS spectrograph red grism (r2k), center slit with 1.2″ width, and the OG530 filter. This setup gave a spectral range of 5515–9635 Å and a dispersion of 1 Å pixel−1. We acquired Hg-Ne comparison lamp spectra on each target position for the wavelength calibration.
A.2. OAN-SPM
Sources in the northern hemisphere (i.e., at Dec > 0°) were observed with the 2.1 m telescope of the OAN-SPM in San Pedro Mártir (Mexico) in two observing runs on 2018 August 4 and 2019 July 2–7.
The telescope carries a Boller and Chivens spectrograph with a 1024 × 1024 pixel E2V 4240 CCD, tuned to the 4000–8000 Å range with a resolution of 10 Å pixel−1 and a slit width of 2.5″. Wavelength calibration was done using CuHe-NeAr and He-Ar comparison lamps.
For each acquisition, we carried out bias subtraction, flat-field correction, and cosmic-ray removal. To remove cosmic rays, we collected two or three individual exposures per target and averaged them. The multiple exposures allowed us to identify dubious spectral features using the L.A. Cosmic IRAF algorithm (van Dokkum 2001).
A.3. SDSS archival search
To investigate those UGSs lying in the SDSS footprint and to search for new BL Lac objects, we adopted the same procedure as described in Massaro et al. (2016), Peña-Herazo et al. (2019). In summary, we first searched for all UGSs in the footprint of the SDSS DR15. We then selected UGSs that have at least one source (with an available optical spectrum and lying within their γ-ray positional uncertainty region). Then, we visually inspected all these optical sources selecting those with a typical BL Lac spectrum (i.e., featureless or with emission–absorption lines with EW < 5 Å).
We note that for all UGSs analyzed using the SDSS spectra, we carried out our investigation and provided the classifications directly to the Fermi-LAT collaboration. Thus, they appeared originally as UGS only in the preliminary version of the 4FGL used to select our targets. For the following we continue to consider them as UGSs; however, in Table 2 we report their new classifications in the final published 4FGL in parentheses. Basically they are listed as 2 BCUs, 5 BL Lacs, and 1 UGS. These eight sources all appear to be BZBs with no redshift estimates due to their featureless spectra with the exception of 7C 1032+4424 (4FGL J1035.6+4409) at z = 0.444, which is classified as a blazar of galaxy type (BZG) according to the criteria outlined in the Roma-BZCAT (Massaro et al. 2009, 2015b).
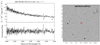 |
Fig. A.1. Left panels: optical spectrum of WISE J083706.00+583152.9, the potential counterpart of 4FGL J0836.9+5833. The signal-to-noise ratio (S/N) of the spectrum is indicated along the top. Right panel: finding chart (5′×5′) retrieved from the Digitized Sky Survey (DSS) highlighting the location of the counterpart (red circle). |
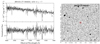 |
Fig. A.2. As in Fig. A.1, but for WISE J091451.57+584438.1, the potential counterpart of 4FGL J0914.8+5846. |
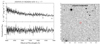 |
Fig. A.3. As in Fig. A.1, but for WISE J101919.15+562428.8, the potential counterpart of 4FGL J1019.3+5625. |
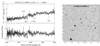 |
Fig. A.4. As in Fig. A.1, but for WISE J103532.12+440931.4, the potential counterpart of 4FGL J1035.6+4409. |
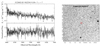 |
Fig. A.5. As in Fig. A.1, but for WISE J122602.82+562254.9, the potential counterpart of 4FGL J1226.0+5622. |
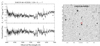 |
Fig. A.7. As in Fig. A.1, but for WISE J140319.46+432020.1, the potential counterpart of 4FGL J1403.4+4319. |
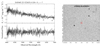 |
Fig. A.8. As in Fig. A.1, but for WISE J145445.32+523655.4, the potential counterpart of 4FGL J1454.7+5237. |
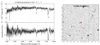 |
Fig. A.10. As in Fig. A.1, but for J154458.88-664146.9, the potential counterpart of 3FGL J1545.0-6641. |
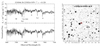 |
Fig. A.11. As in Fig. A.1, but for WISE J154546.58-233928.4, the counterpart of 4FGL J1545.8-2336. |
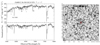 |
Fig. A.12. As in Fig. A.1, but for WISE J160012.36-581102.8, the counterpart of 4FGL J1600.3-5811. |
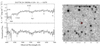 |
Fig. A.13. As in Fig. A.1, but for WISE J163738.24+300506.4, the potential counterpart of 4FGL J1637.5+3005. |
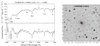 |
Fig. A.14. As in Fig. A.1, but for WISE J164058.89+114404.2, the counterpart of 4FGL J1640.9+1143. |
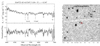 |
Fig. A.15. As in Fig. A.1, but for WISE J164723.42+615347.5, the potential counterpart of 4FGL J1647.1+6149. |
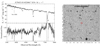 |
Fig. A.16. As in Fig. A.1, but for WISE J170433.83-052840.7, the potential counterpart of 3FGL J1704.4-0528. |
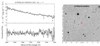 |
Fig. A.17. As in Fig. A.1, but for WISE J170520.54+543659.8, the potential counterpart of 4FGL J1705.4+5436. |
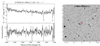 |
Fig. A.18. As in Fig. A.1, but for WISE J170650.43+300412.5, the potential counterpart of 4FGL J1706.8+3004. |
 |
Fig. A.19. As in Fig. A.1, but for WISE J174419.81+185217.9, the counterpart of 4FGL J1744.4+1851. |
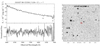 |
Fig. A.20. As in Fig. A.1, but for WISE J181037.98+533501.5, the counterpart of 4FGL J1810.7+5335. |
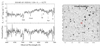 |
Fig. A.21. As in Fig. A.1, but for WISE J181403.43+382810.1, the counterpart of 4FGL J1814.0+3828. |
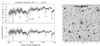 |
Fig. A.22. As in Fig. A.1, but for WISE J183820.63-602522.6, the counterpart of 4FGL J1838.4-6023. |
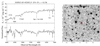 |
Fig. A.23. As in Fig. A.1, but for WISE J185813.43+432451.9, the counterpart of 4FGL J1858.3+4321. |
 |
Fig. A.24. As in Fig. A.1, but for WISE J192935.09+614629.4, the counterpart of 4FGL J1929.4+6146. |
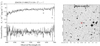 |
Fig. A.25. As in Fig. A.1, but for WISE J204350.15+000127.8, the counterpart of 4FGL J2043.7+0000. |
 |
Fig. A.26. As in Fig. A.1, but for WISE J204644.01-425713.2, the counterpart of 4FGL J2046.8-4258. |
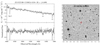 |
Fig. A.27. As in Fig. A.1, but for WISE J211522.00+121802.6, the counterpart of 4FGL J2115.2+1218. |
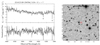 |
Fig. A.28. As in Fig. A.1, but for WISE J214123.89+294706.2, the potential counterpart of 4FGL J2141.4+2947. |
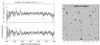 |
Fig. A.29. As in Fig. A.1, but for WISE J220812.70+035304.5, the potential counterpart of 4FGL J2208.2+0350. |
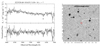 |
Fig. A.30. As in Fig. A.1, but for WISE J223528.60+181635.5, the potential counterpart of 4FGL J2235.3+1818. |
Appendix B: Summary tables
Here we report the first 12 lines of the two main tables summarizing the results achieved thanks to our optical spectroscopic campaign including all 394 targets (Table B.1), and obtained from the literature consisting of a total of 123 sources (Table B.2). The full tables are available at the CDS.
Summary of results from our optical spectroscopic campaign.
Summary of literature search.
All Tables
Gamma-ray classification of targets observed during our spectroscopic campaign as reported in each Fermi-LAT catalog.
Fractions of Fermi-LAT sources of uncertain nature (i.e., AGUs, BCUs, and UGSs) analyzed during our campaign and computed with respect to the total number in each Fermi-LAT catalog.
Classification results achieved thanks to our optical spectroscopic campaign split with respect to sources listed in each Fermi-LAT catalog.
Gamma-ray classification of sources analyzed in the literature as reported in each Fermi-LAT catalog.
Classification results collected from the literature distinguishing sources belonging to each Fermi-LAT catalog.
Comparison between the expected classification provided in WIBRaLS2 catalog with those obtained in our optical spectroscopic campaign.
Comparison between the expected classification provided in WIBRaLS2 catalog with those obtained in our literature search.
All Figures
|
Fig. 1. Cumulative distributions of all sources observed during our spectroscopic campaign (solid bars) and classified as BZBs (left panel in blue) or BZQs (right panel in red) in addition to those found in our archival searches of other spectroscopic surveys (hatched bars). |
| In the text | |
|
Fig. 2. Projections on the three WISE color-color planes of spectroscopically identified sources discussed in this paper with counterparts in WIBRaLS. Red, blue, and yellow points respectively indicate candidates classified as BZQ, BZB, and BZG sources based on their optical spectra. Circles and stars are associated with sources observed in this campaign and sources for which spectra are available in the literature, respectively. The black lines on the three planes are the isodensity contours of the 2D projections of the 3D color distribution of locus sources (not plotted for clarity) used to define the WIBRaLS 3D model in the WISE colors space. |
| In the text | |
|
Fig. A.1. Left panels: optical spectrum of WISE J083706.00+583152.9, the potential counterpart of 4FGL J0836.9+5833. The signal-to-noise ratio (S/N) of the spectrum is indicated along the top. Right panel: finding chart (5′×5′) retrieved from the Digitized Sky Survey (DSS) highlighting the location of the counterpart (red circle). |
| In the text | |
|
Fig. A.2. As in Fig. A.1, but for WISE J091451.57+584438.1, the potential counterpart of 4FGL J0914.8+5846. |
| In the text | |
|
Fig. A.3. As in Fig. A.1, but for WISE J101919.15+562428.8, the potential counterpart of 4FGL J1019.3+5625. |
| In the text | |
|
Fig. A.4. As in Fig. A.1, but for WISE J103532.12+440931.4, the potential counterpart of 4FGL J1035.6+4409. |
| In the text | |
|
Fig. A.5. As in Fig. A.1, but for WISE J122602.82+562254.9, the potential counterpart of 4FGL J1226.0+5622. |
| In the text | |
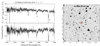 |
Fig. A.6. As in Fig. A.1, but for WISE J123806.03-454129.6, the counterpart of 4FGL J1238.1-4541. |
| In the text | |
|
Fig. A.7. As in Fig. A.1, but for WISE J140319.46+432020.1, the potential counterpart of 4FGL J1403.4+4319. |
| In the text | |
|
Fig. A.8. As in Fig. A.1, but for WISE J145445.32+523655.4, the potential counterpart of 4FGL J1454.7+5237. |
| In the text | |
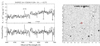 |
Fig. A.9. As in Fig. A.1, but for WISE J145922.16+152654.9, the counterpart of 4FGL J1459.5+1527. |
| In the text | |
|
Fig. A.10. As in Fig. A.1, but for J154458.88-664146.9, the potential counterpart of 3FGL J1545.0-6641. |
| In the text | |
|
Fig. A.11. As in Fig. A.1, but for WISE J154546.58-233928.4, the counterpart of 4FGL J1545.8-2336. |
| In the text | |
|
Fig. A.12. As in Fig. A.1, but for WISE J160012.36-581102.8, the counterpart of 4FGL J1600.3-5811. |
| In the text | |
|
Fig. A.13. As in Fig. A.1, but for WISE J163738.24+300506.4, the potential counterpart of 4FGL J1637.5+3005. |
| In the text | |
|
Fig. A.14. As in Fig. A.1, but for WISE J164058.89+114404.2, the counterpart of 4FGL J1640.9+1143. |
| In the text | |
|
Fig. A.15. As in Fig. A.1, but for WISE J164723.42+615347.5, the potential counterpart of 4FGL J1647.1+6149. |
| In the text | |
|
Fig. A.16. As in Fig. A.1, but for WISE J170433.83-052840.7, the potential counterpart of 3FGL J1704.4-0528. |
| In the text | |
|
Fig. A.17. As in Fig. A.1, but for WISE J170520.54+543659.8, the potential counterpart of 4FGL J1705.4+5436. |
| In the text | |
|
Fig. A.18. As in Fig. A.1, but for WISE J170650.43+300412.5, the potential counterpart of 4FGL J1706.8+3004. |
| In the text | |
|
Fig. A.19. As in Fig. A.1, but for WISE J174419.81+185217.9, the counterpart of 4FGL J1744.4+1851. |
| In the text | |
|
Fig. A.20. As in Fig. A.1, but for WISE J181037.98+533501.5, the counterpart of 4FGL J1810.7+5335. |
| In the text | |
|
Fig. A.21. As in Fig. A.1, but for WISE J181403.43+382810.1, the counterpart of 4FGL J1814.0+3828. |
| In the text | |
|
Fig. A.22. As in Fig. A.1, but for WISE J183820.63-602522.6, the counterpart of 4FGL J1838.4-6023. |
| In the text | |
|
Fig. A.23. As in Fig. A.1, but for WISE J185813.43+432451.9, the counterpart of 4FGL J1858.3+4321. |
| In the text | |
|
Fig. A.24. As in Fig. A.1, but for WISE J192935.09+614629.4, the counterpart of 4FGL J1929.4+6146. |
| In the text | |
|
Fig. A.25. As in Fig. A.1, but for WISE J204350.15+000127.8, the counterpart of 4FGL J2043.7+0000. |
| In the text | |
|
Fig. A.26. As in Fig. A.1, but for WISE J204644.01-425713.2, the counterpart of 4FGL J2046.8-4258. |
| In the text | |
|
Fig. A.27. As in Fig. A.1, but for WISE J211522.00+121802.6, the counterpart of 4FGL J2115.2+1218. |
| In the text | |
|
Fig. A.28. As in Fig. A.1, but for WISE J214123.89+294706.2, the potential counterpart of 4FGL J2141.4+2947. |
| In the text | |
|
Fig. A.29. As in Fig. A.1, but for WISE J220812.70+035304.5, the potential counterpart of 4FGL J2208.2+0350. |
| In the text | |
|
Fig. A.30. As in Fig. A.1, but for WISE J223528.60+181635.5, the potential counterpart of 4FGL J2235.3+1818. |
| In the text | |
Current usage metrics show cumulative count of Article Views (full-text article views including HTML views, PDF and ePub downloads, according to the available data) and Abstracts Views on Vision4Press platform.
Data correspond to usage on the plateform after 2015. The current usage metrics is available 48-96 hours after online publication and is updated daily on week days.
Initial download of the metrics may take a while.