Fig. 2.
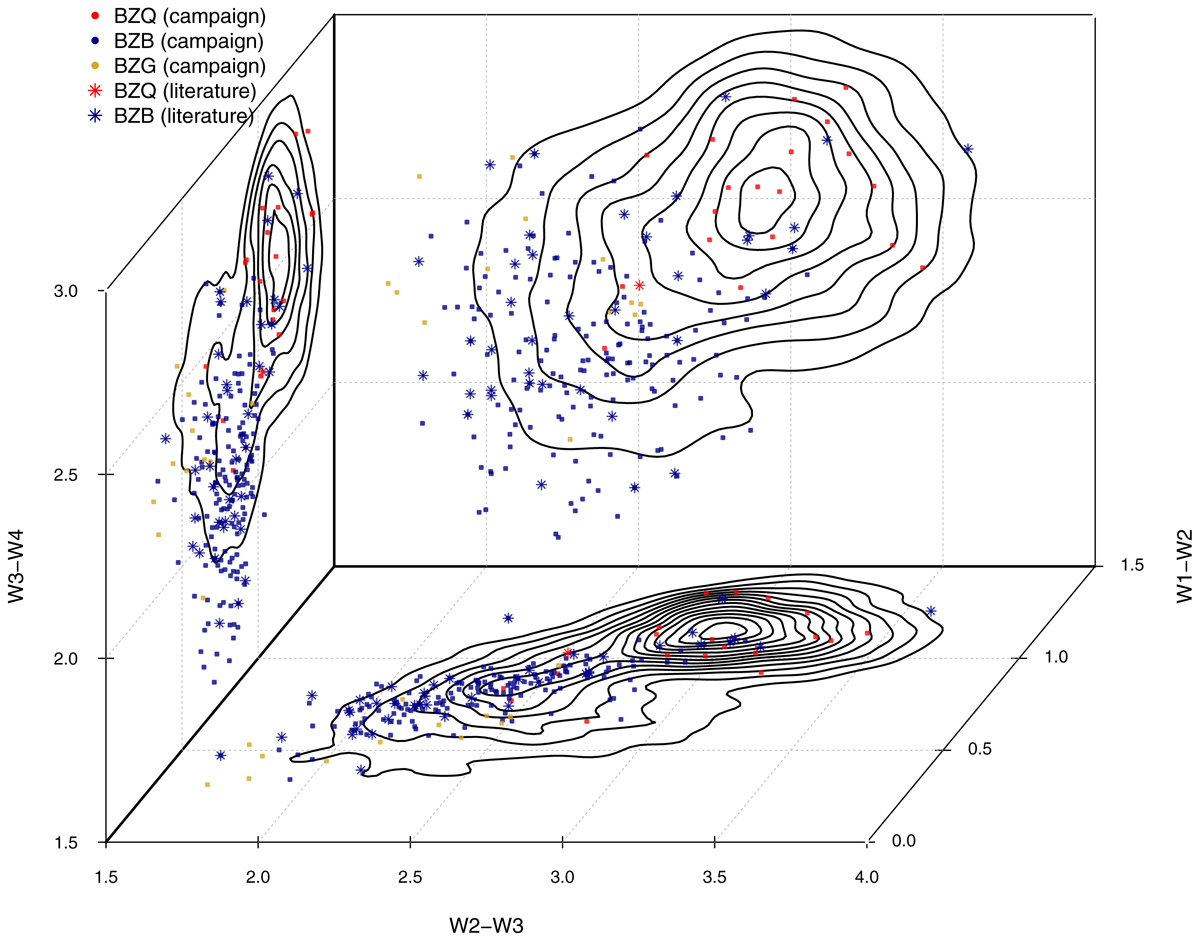
Projections on the three WISE color-color planes of spectroscopically identified sources discussed in this paper with counterparts in WIBRaLS. Red, blue, and yellow points respectively indicate candidates classified as BZQ, BZB, and BZG sources based on their optical spectra. Circles and stars are associated with sources observed in this campaign and sources for which spectra are available in the literature, respectively. The black lines on the three planes are the isodensity contours of the 2D projections of the 3D color distribution of locus sources (not plotted for clarity) used to define the WIBRaLS 3D model in the WISE colors space.
Current usage metrics show cumulative count of Article Views (full-text article views including HTML views, PDF and ePub downloads, according to the available data) and Abstracts Views on Vision4Press platform.
Data correspond to usage on the plateform after 2015. The current usage metrics is available 48-96 hours after online publication and is updated daily on week days.
Initial download of the metrics may take a while.