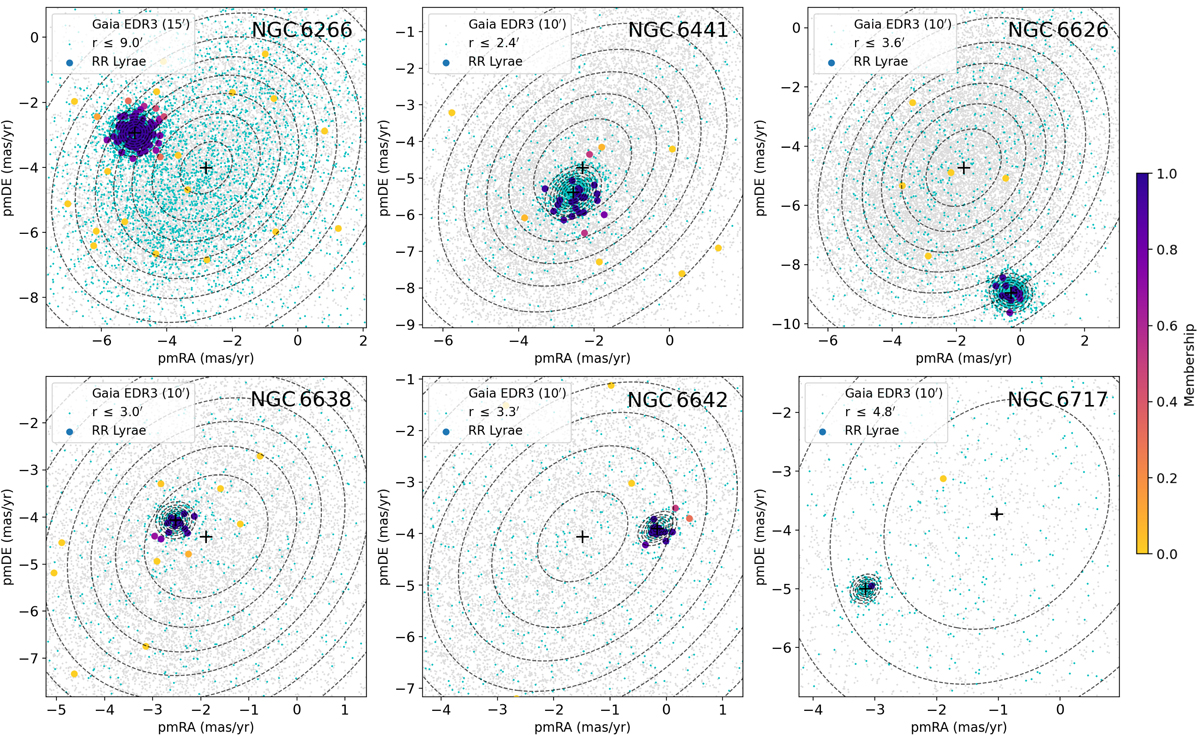
Fig. 3.
Download original image
PM diagram of the sample clusters, with the RR Lyrae colour-coded by the membership values. The background stars are divided into those that are more central and those that are further out, shown as cyan and grey points. The two-dimensional Gaussian distributions mark the central cluster and field PMs, along with the dispersions (contour lines mark 0.25 − 2σ in steps of 0.25σ), as derived from the GMM method. The diagrams in the lower panels are zoomed in due to the lower dispersion of the cluster PMs.
Current usage metrics show cumulative count of Article Views (full-text article views including HTML views, PDF and ePub downloads, according to the available data) and Abstracts Views on Vision4Press platform.
Data correspond to usage on the plateform after 2015. The current usage metrics is available 48-96 hours after online publication and is updated daily on week days.
Initial download of the metrics may take a while.