Fig. 3
Download original image
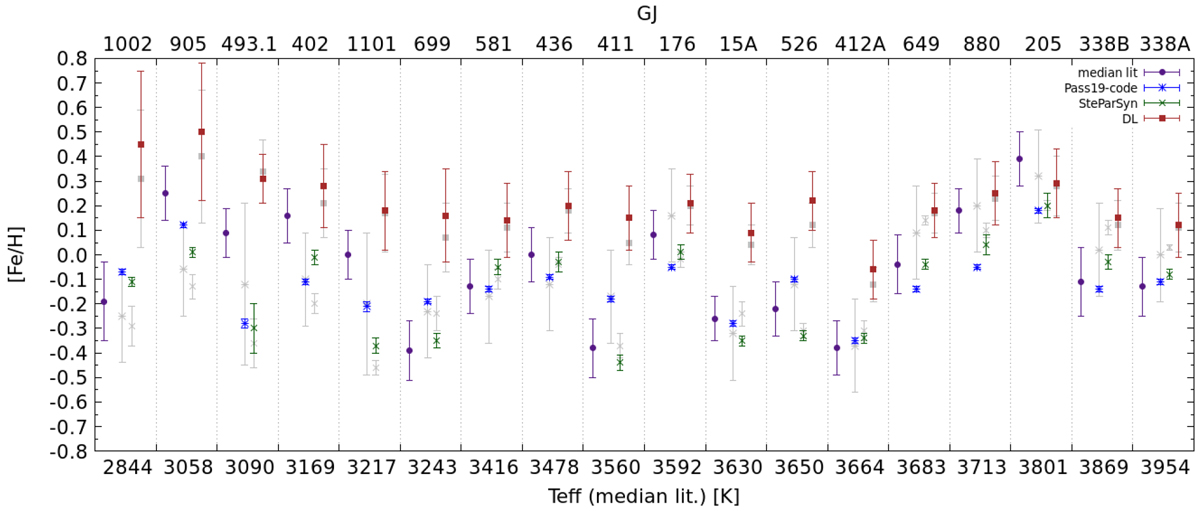
Comparison of [Fe/H] for the different methods in Run B. Each method is indicated with adifferent symbol and color. The gray symbols indicate the results from Run A for comparison. The median of all literature values is shown as purple dots. The x-axis indicates Teff from the median literature, the top axis shows the Gliese–Jahreiss (GJ) numbers for all sample stars.
Current usage metrics show cumulative count of Article Views (full-text article views including HTML views, PDF and ePub downloads, according to the available data) and Abstracts Views on Vision4Press platform.
Data correspond to usage on the plateform after 2015. The current usage metrics is available 48-96 hours after online publication and is updated daily on week days.
Initial download of the metrics may take a while.