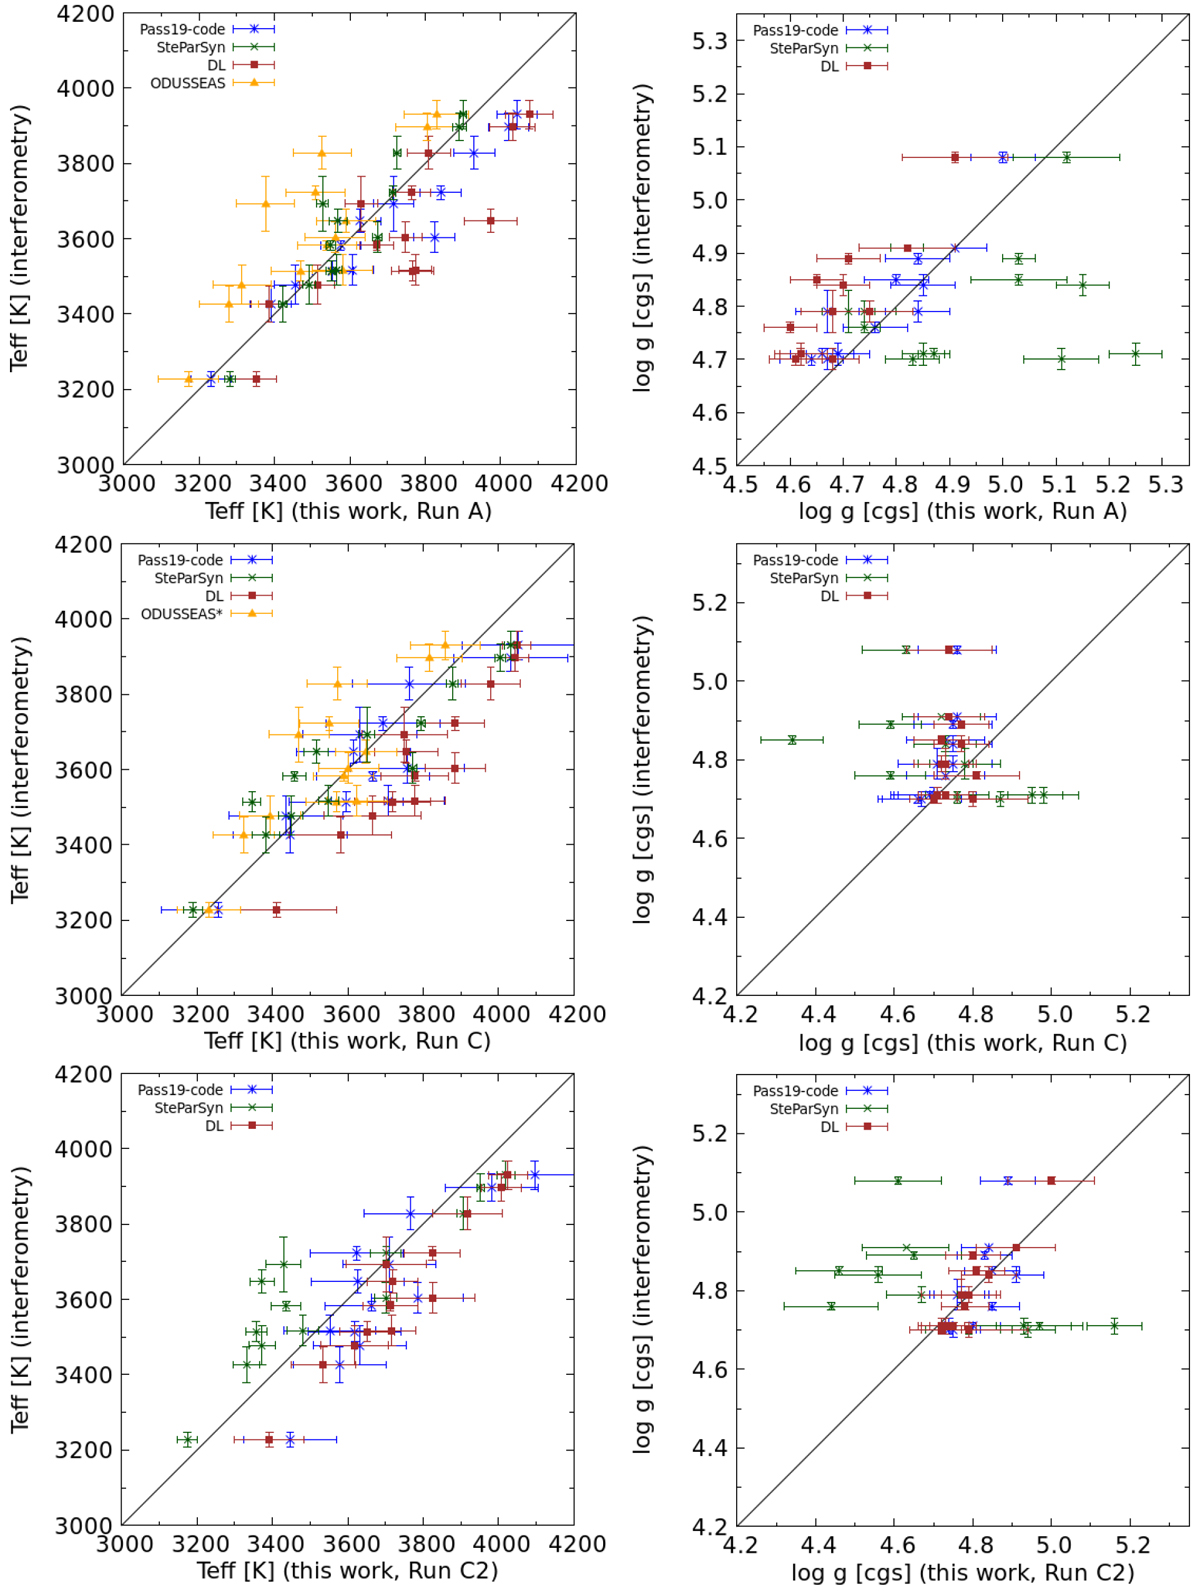
Fig. 5
Download original image
Comparison of our results for Teff (left column) and log g (right column) from Run A (top), Run C (middle), and Run C2 (bottom) with interferometric radii from Boyajian et al. (2012), von Braun et al. (2014), Newton et al. (2015), and Rabus et al. (2019). If more than one value exists for a star in literature, we plot the mean with the RMSE for better readability. Results from ODUSSEAS in Run C correspond to their Run C*. The black line indicates the 1:1 relationship.
Current usage metrics show cumulative count of Article Views (full-text article views including HTML views, PDF and ePub downloads, according to the available data) and Abstracts Views on Vision4Press platform.
Data correspond to usage on the plateform after 2015. The current usage metrics is available 48-96 hours after online publication and is updated daily on week days.
Initial download of the metrics may take a while.