Fig. B.3
Download original image
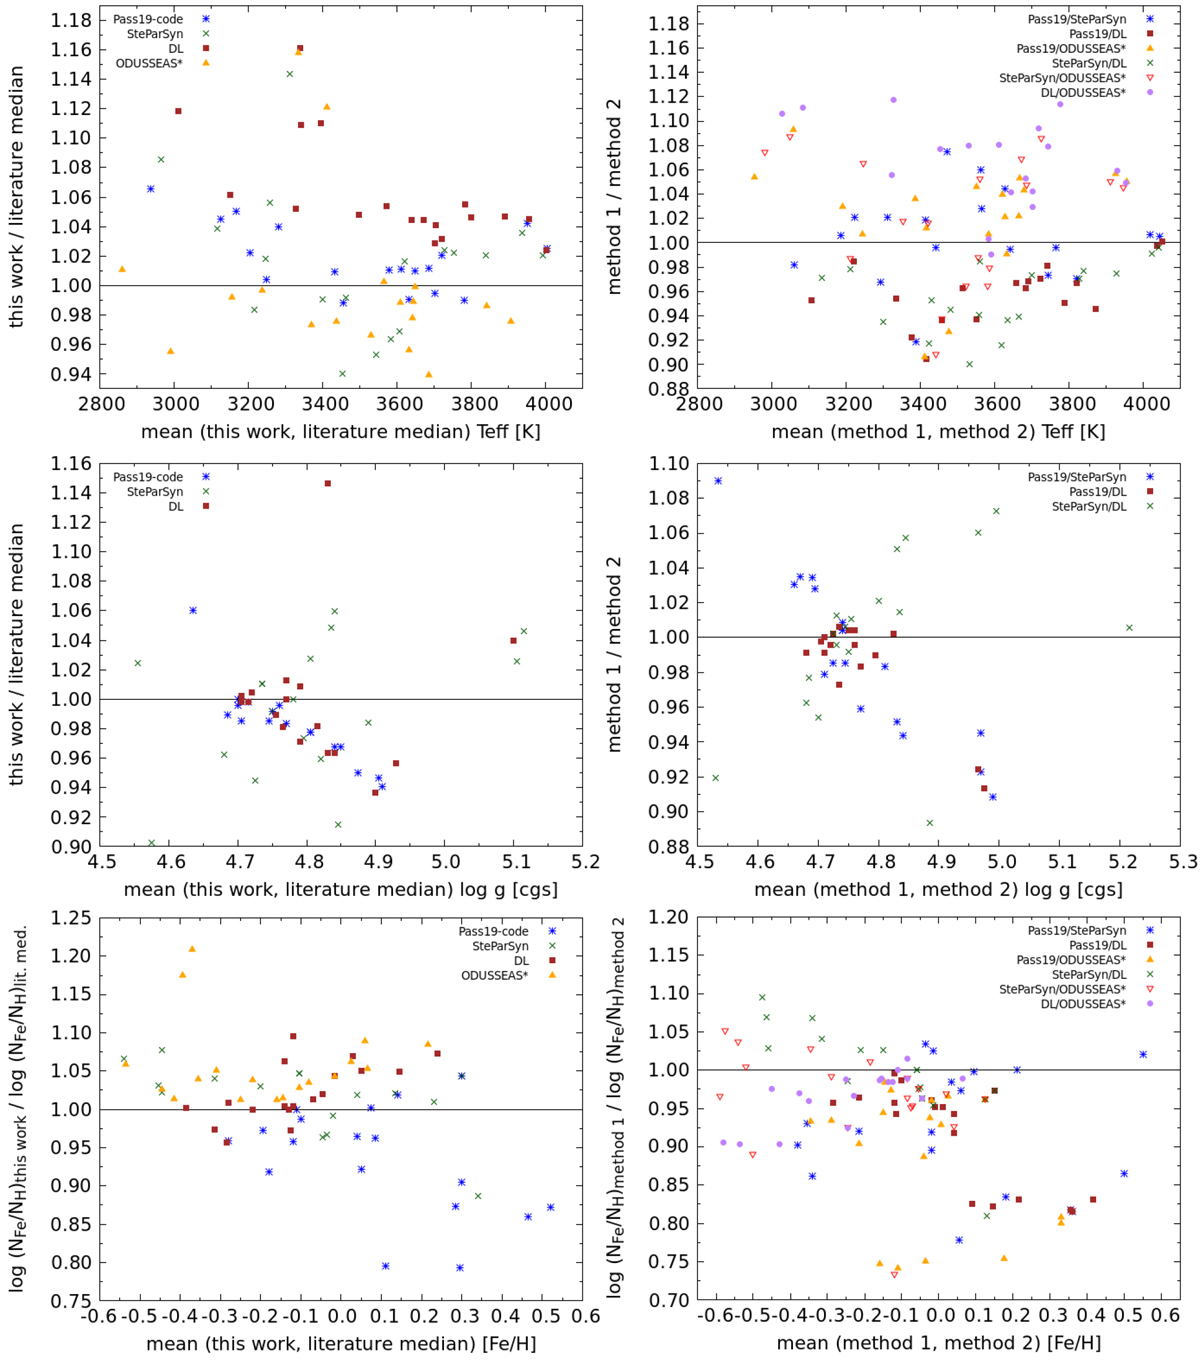
Modified Bland-Altman plot for Run C, showing the mean of two methods on the x-axis and the ratioon the y-axis. The left column presents the comparison between the literature median and our methods (color-coded) for Teff (top), log g (middle), and [Fe/H] (bottom). The right column presents the comparison between our methods. Each symbol represents a different combination of our methods, as shown in the legend. For [Fe/H] the y-axis shows the ratio of the number of Fe and H atoms in order to avoid division by zero. See text for details.
Current usage metrics show cumulative count of Article Views (full-text article views including HTML views, PDF and ePub downloads, according to the available data) and Abstracts Views on Vision4Press platform.
Data correspond to usage on the plateform after 2015. The current usage metrics is available 48-96 hours after online publication and is updated daily on week days.
Initial download of the metrics may take a while.