Fig. A.7
Download original image
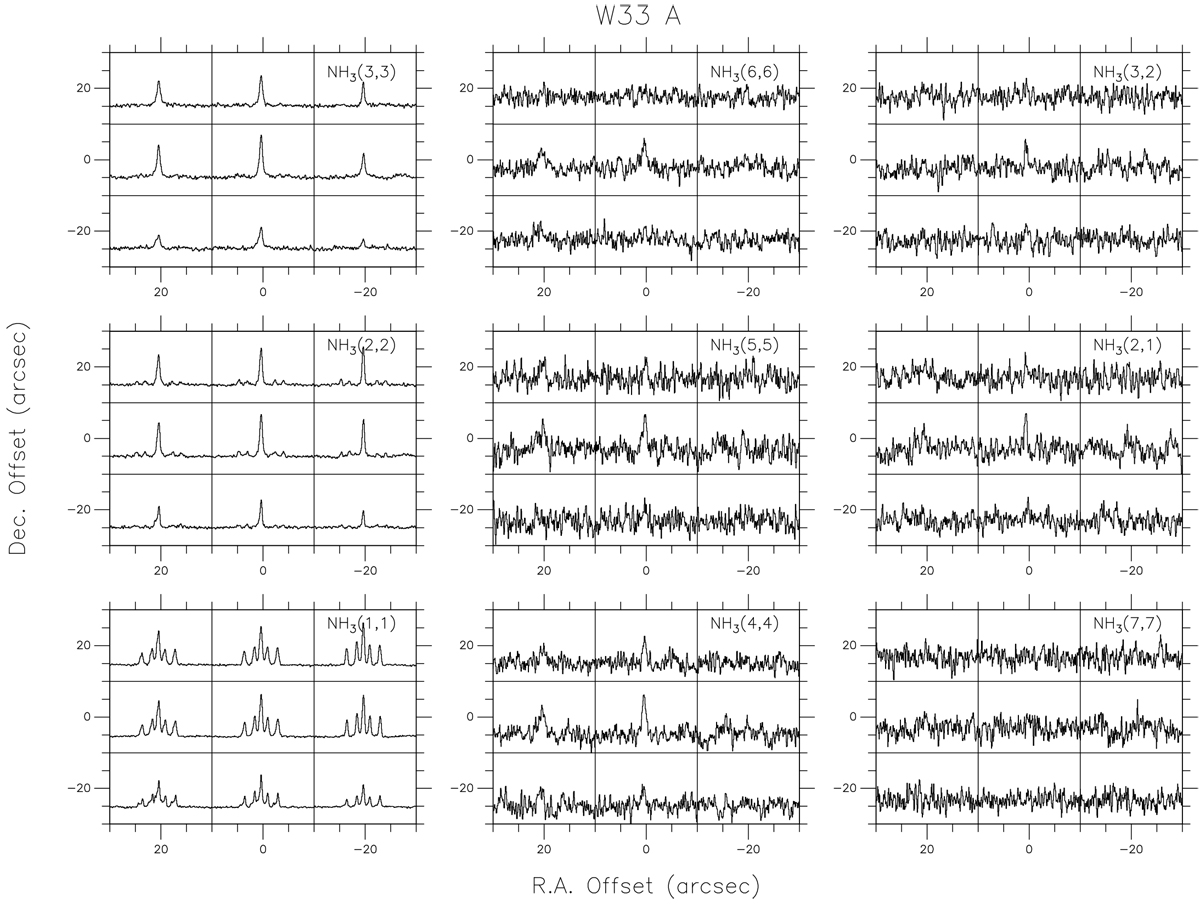
Line profiles of inversion transitions of ammonia from W33 A. These are shown on (Δα, Δδ) axes. The zero point is at the position of W33 A, R.A. : 18:14:39.10, DEC. : -17:52:03.0 (J2000). The X and Y axes indicate Right Ascension Offset (arcsec) and Declination Offset (arcsec), respectively. The main beam temperature scale for the NH3 lines was obtained from continuum cross scans of 3C 286 (see Sect. 2). All radial velocities are on a VLSR scale. At the assumed distance to the complex, ~2.4 kpc, 40′′ is equivalent to 0.5 pc. The individual spectra cover a velocity range of 32 to 38 km s−1 and the ordinate provides main beam brightness temperatures in the range – 0.1 to 5.2 K (left panel), – 0.1 to 0.5 K (middle panel), and – 0.1 to 0.5 K (right panel).
Current usage metrics show cumulative count of Article Views (full-text article views including HTML views, PDF and ePub downloads, according to the available data) and Abstracts Views on Vision4Press platform.
Data correspond to usage on the plateform after 2015. The current usage metrics is available 48-96 hours after online publication and is updated daily on week days.
Initial download of the metrics may take a while.