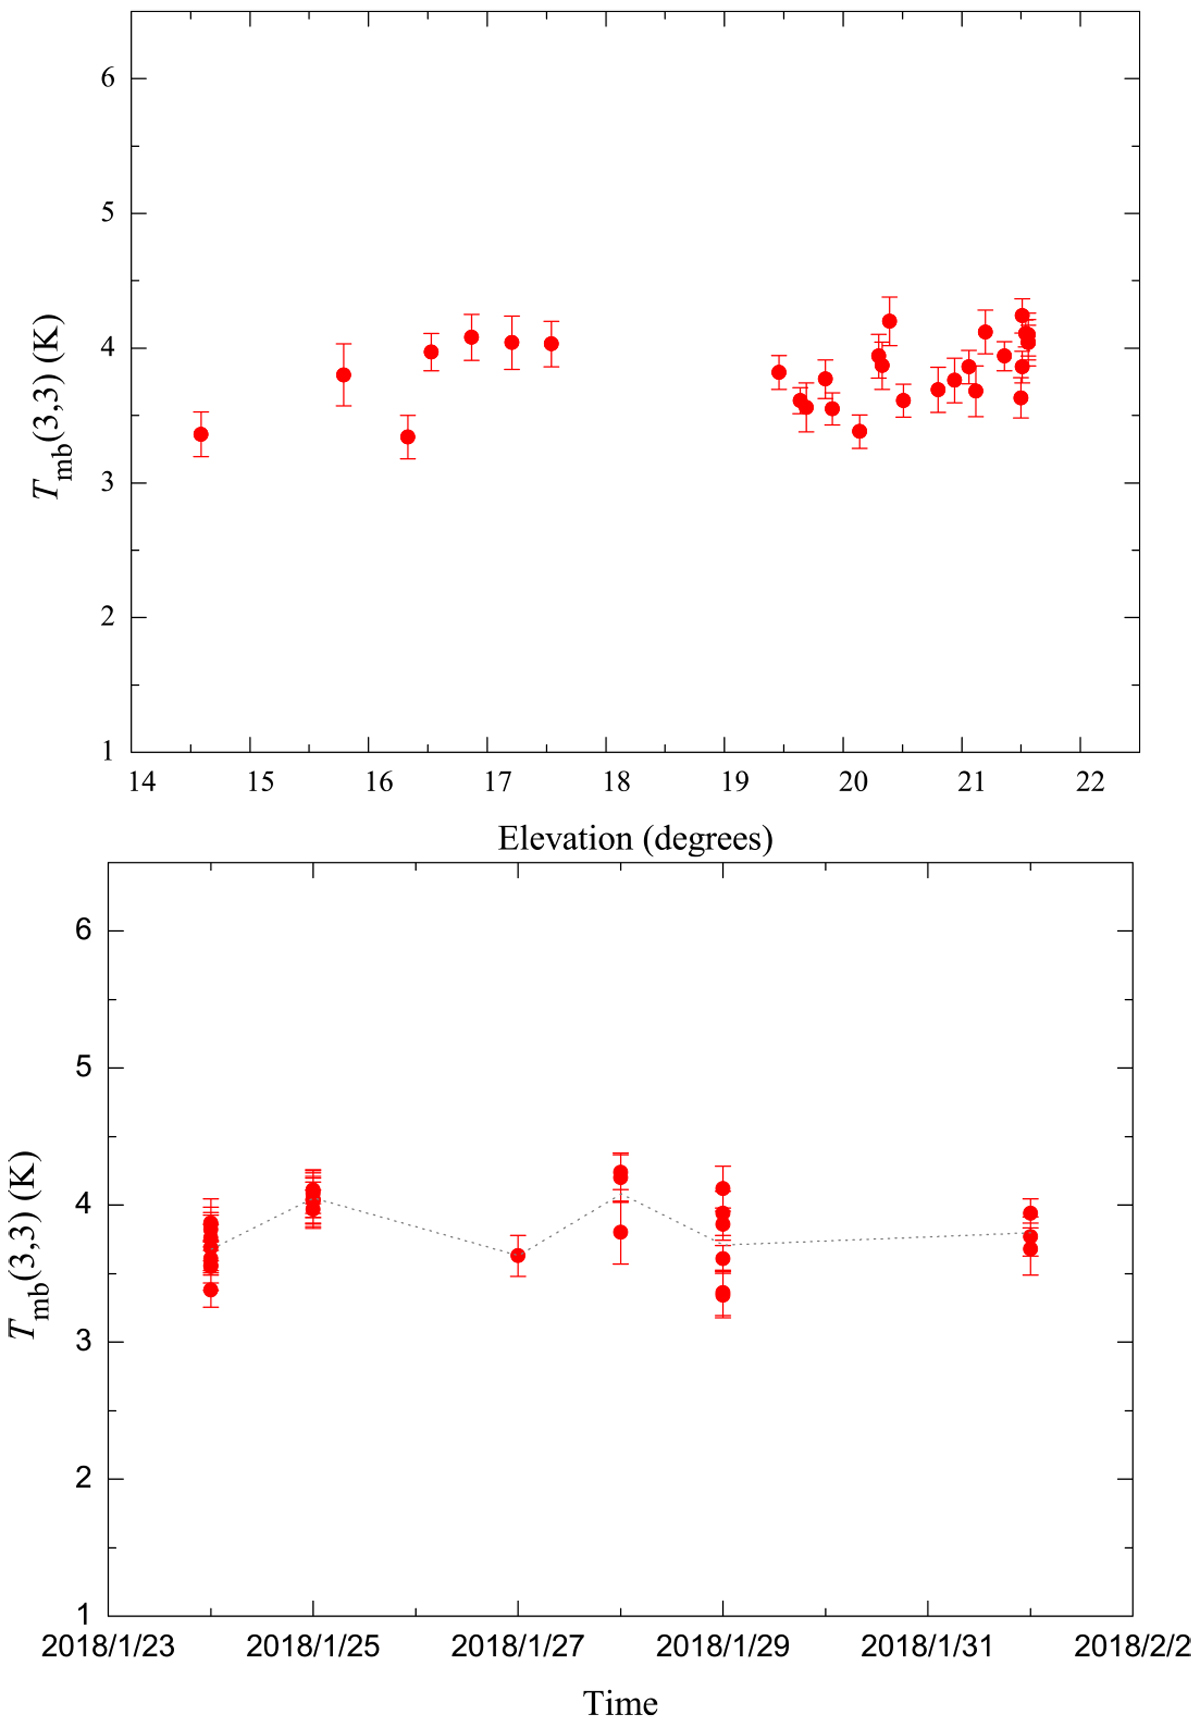
Fig. B.2
Download original image
Top panel: NH3 (3,3) main line peak intensities against elevation of repeated observations toward the reference position of W33 Main (see Table 1). The standard deviations of the mean of the flux density is about 4.4%. Bottom panel: NH3 (3,3) main line peak intensities against the epoch of the observation, also toward the W33 Main peak position. The gray dotted line connects the average Tmb (3,3) values of each day.
Current usage metrics show cumulative count of Article Views (full-text article views including HTML views, PDF and ePub downloads, according to the available data) and Abstracts Views on Vision4Press platform.
Data correspond to usage on the plateform after 2015. The current usage metrics is available 48-96 hours after online publication and is updated daily on week days.
Initial download of the metrics may take a while.