Fig. C.1
Download original image
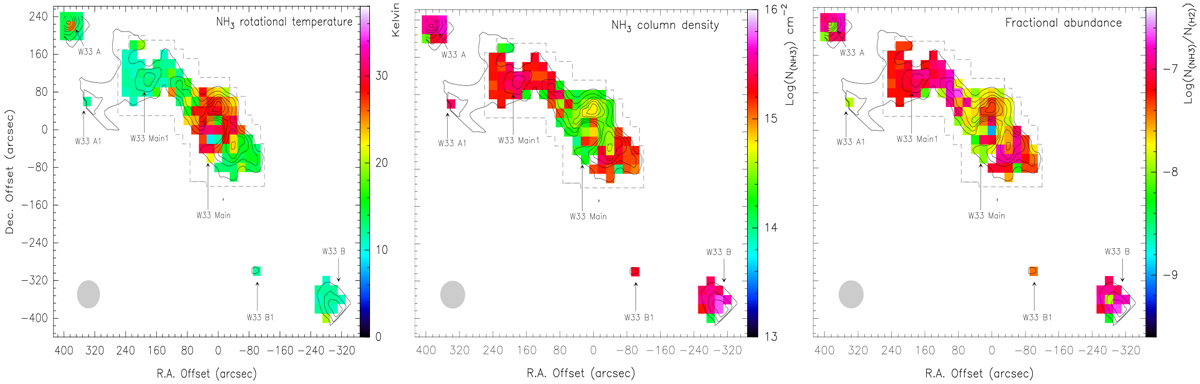
Maps of NH3 rotational temperature in units of Kelvin (left), the logarithm of the total-NH3 column density in units of cm−2 (middle), and the corresponding logarithm of the fractional abundance (right). The reference position is R.A. : 18:14:13.50, DEC. : -17:55:47.0 (J2000). The integration range is 32 to 40 km s−1. Contours are the same as in the left panel of Fig. 6. The limits of the mapped region over significant parts of our map are indicated by gray dashed lines. The half-power beam width is illustrated as a gray filled circle in the lower left corner of each image.
Current usage metrics show cumulative count of Article Views (full-text article views including HTML views, PDF and ePub downloads, according to the available data) and Abstracts Views on Vision4Press platform.
Data correspond to usage on the plateform after 2015. The current usage metrics is available 48-96 hours after online publication and is updated daily on week days.
Initial download of the metrics may take a while.