Fig. 6
Download original image
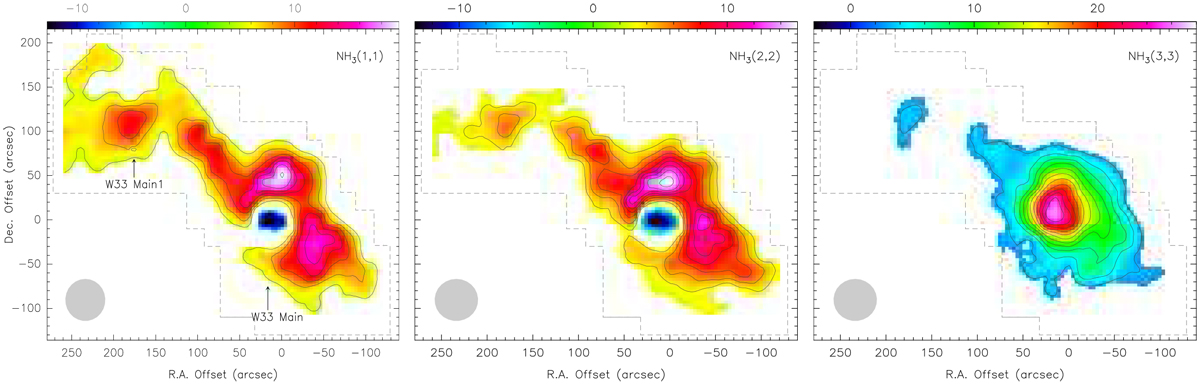
Integrated intensity maps of NH3 (1,1) (left), (2,2) (middle), and (3,3) (right) for the W33 Main and W33 Main1 regions. The reference position is RA: 18:14:13.50, Dec: −17:55:47.0 (J2000). Theintegration range is 32 to 40 km s−1. Contours start at 3.14 K km s−1 (3σ) on a main beam brightness temperature scale and go up in steps of 3.14 K km s−1. The unit of the color bar is K km s−1. The limits of the mapped region are indicated with gray dashed lines. While the NH3 (1,1) and (2,2) lines show absorption near the reference position, the (3,3) line emission indicates a peak in this region. The half-power beam width is illustrated as a gray filled circle in the lower left corners of the images.
Current usage metrics show cumulative count of Article Views (full-text article views including HTML views, PDF and ePub downloads, according to the available data) and Abstracts Views on Vision4Press platform.
Data correspond to usage on the plateform after 2015. The current usage metrics is available 48-96 hours after online publication and is updated daily on week days.
Initial download of the metrics may take a while.