Fig. 7
Download original image
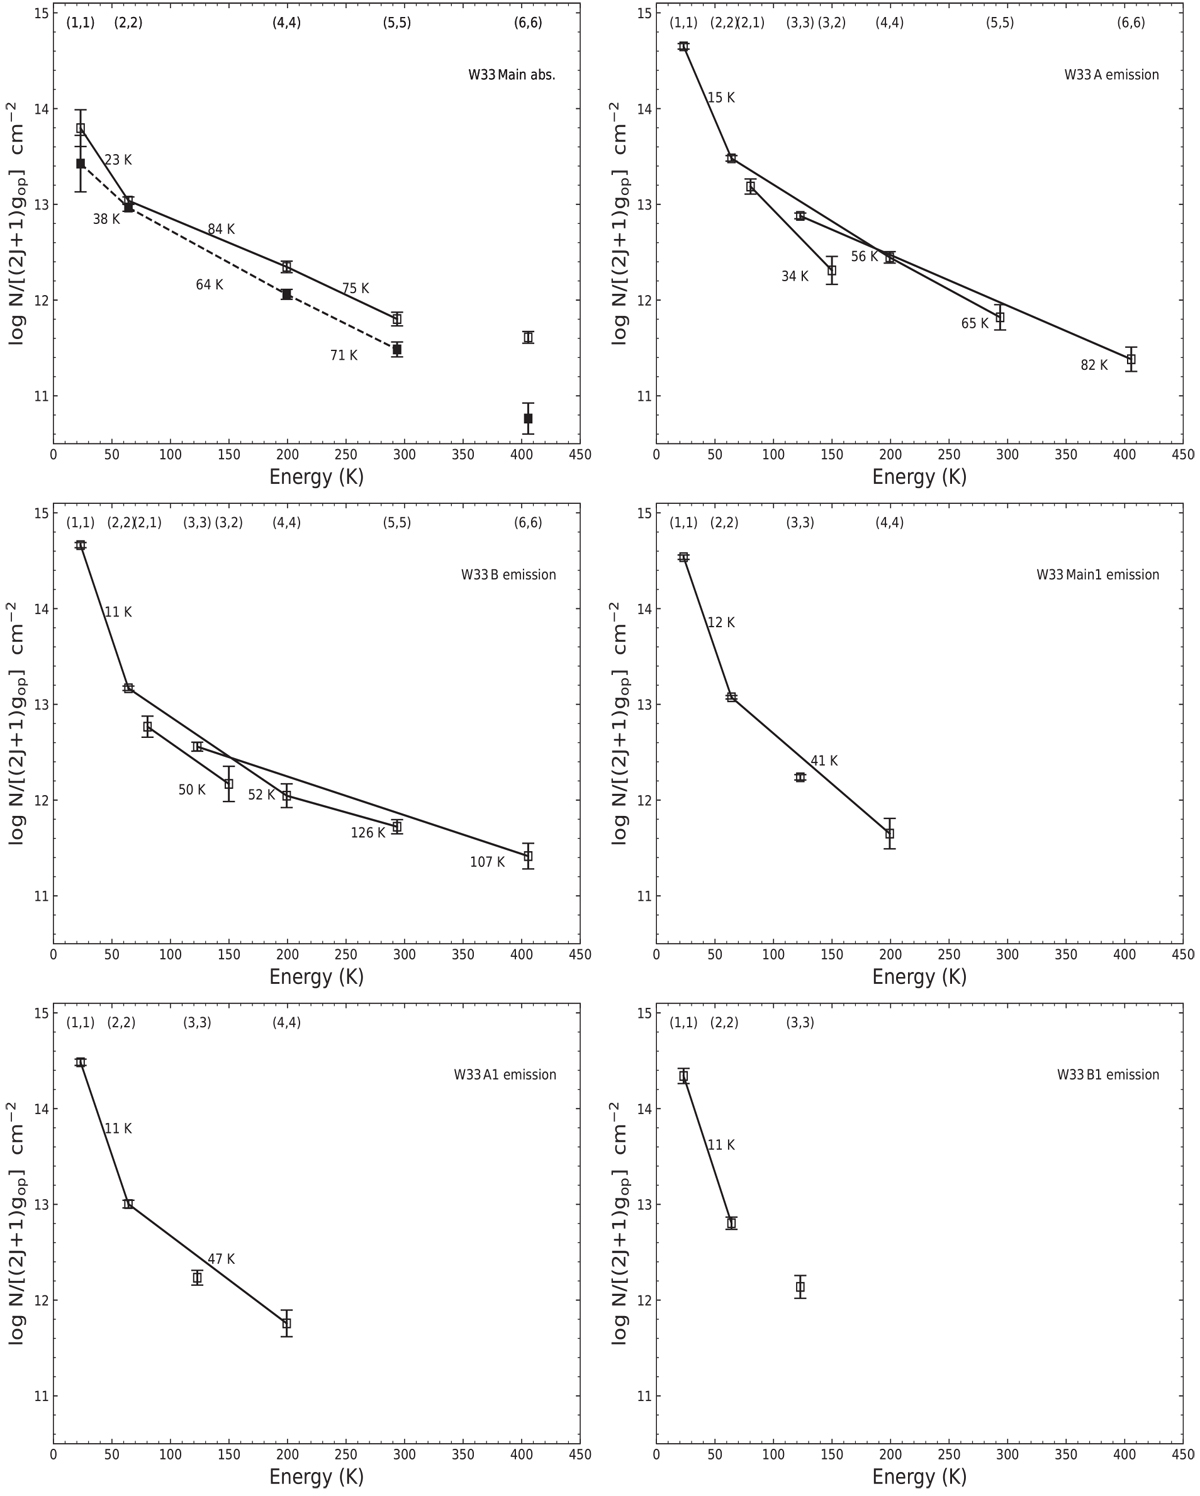
Boltzmann plots (rotation diagrams) for the W33 Main absorption lines (top left), W33 A emission lines (top right), W33 B emission lines (second row left), W33 Main1 emission lines (second row right), W33 A1 emission lines (third row left), and W33 B1 emission lines (third row right). The positions taken are those of Table 1. The solid and dashed lines in the top left panel represent the first velocity component at VLSR ~ 33 km s−1 and second velocity component at VLSR ~ 38 km s−1, respectively. For para-NH3, gop = 1. For ortho-NH3, here the (3,3) and (6,6) levels, gop = 2. The rotational temperatures are obtained from the corresponding slopes. The numbers mark the rotational temperatures in K.
Current usage metrics show cumulative count of Article Views (full-text article views including HTML views, PDF and ePub downloads, according to the available data) and Abstracts Views on Vision4Press platform.
Data correspond to usage on the plateform after 2015. The current usage metrics is available 48-96 hours after online publication and is updated daily on week days.
Initial download of the metrics may take a while.