Fig. 4
Download original image
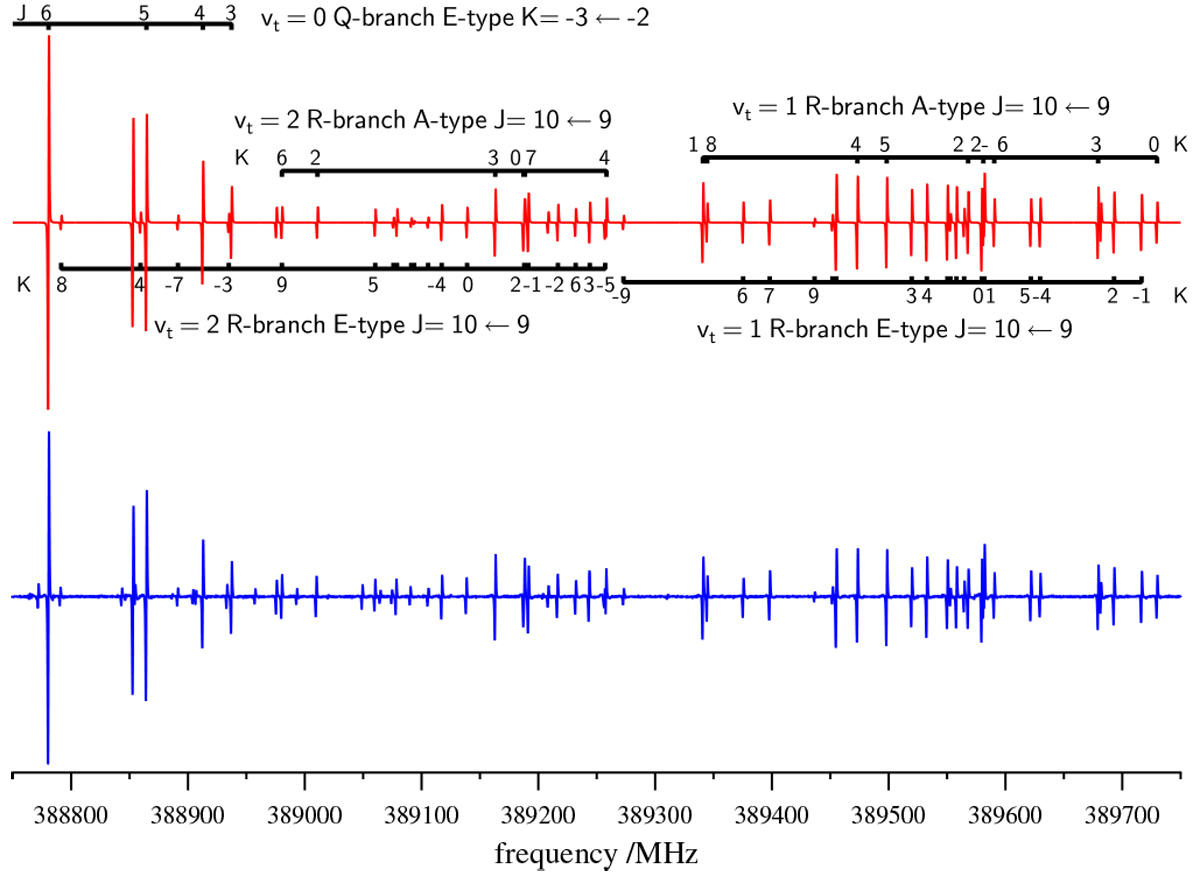
Portion of the CD3OH microwave spectrum dominated by one vt = 0 Q-branch and two R-branches from the vt = 1, 2 excited torsional states in the 388.75−389.55 GHz range. The observed spectrum is shown in the lower panel and the calculated one in the upper panel. The experimental frequencies and the intensity pattern are rather well reproduced by our model for the spectral features dominating this frequency range, although for some vt = 2 E type transitions (see e.g., K = 4, J = 10 ← 9 transition near 388 859 MHz), there are noticeable shifts in frequency with respect to our predictions. The J and selected K quantum numbers are given at the top and the bottom of the upper panel for the dominant spectral branches. We note that for A type transitions of the R branches the K quantum number stands for a degenerate pair of K± transitions in all cases except K = 0,1,2,2- in the vt = 1 state and K = 0 in the vt = 2 state.
Current usage metrics show cumulative count of Article Views (full-text article views including HTML views, PDF and ePub downloads, according to the available data) and Abstracts Views on Vision4Press platform.
Data correspond to usage on the plateform after 2015. The current usage metrics is available 48-96 hours after online publication and is updated daily on week days.
Initial download of the metrics may take a while.