| Issue |
A&A
Volume 658, February 2022
|
|
|---|---|---|
| Article Number | A127 | |
| Number of page(s) | 20 | |
| Section | Interstellar and circumstellar matter | |
| DOI | https://doi.org/10.1051/0004-6361/202142326 | |
| Published online | 10 February 2022 | |
Rotational and rovibrational spectroscopy of CD3OH with an account of CD3OH toward IRAS 16293−2422★
1
Institute of Radio Astronomy of NASU,
Mystetstv 4,
61002
Kharkiv,
Ukraine
e-mail: This email address is being protected from spambots. You need JavaScript enabled to view it.
2
Quantum Radiophysics Department, V. N. Karazin Kharkiv National University,
Kharkiv,
Ukraine
3
I. Physikalisches Institut, Universität zu Köln,
Zülpicher Str. 77,
50937
Köln,
Germany
e-mail: This email address is being protected from spambots. You need JavaScript enabled to view it.
4
Niels Bohr Institute, University of Copenhagen,
Øster Voldgade 5−7,
1350
Copenhagen K,
Denmark
5
Institut für Physikalische und Theoretische Chemie, Technische Universität Braunschweig,
Gaußstr. 17,
38106
Braunschweig,
Germany
6
Organic Chemistry Department, School of Chemistry, V. N. Karazin Kharkiv National University,
Kharkiv,
Ukraine
7
National Research Tomsk Polytechnic University,
Tomsk
634050,
Russia
8
Department of Physics, University of New Brunswick,
Saint John,
NB E2L 4L5,
Canada
Received:
28
September
2021
Accepted:
4
November
2021
Abstract
Solar-type protostars have been shown to harbor highly deuterated complex organics, as evidenced, for instance, by the high relative abundances of doubly and triply deuterated isotopologs. While this degree of deuteration may provide important clues in studying the formation of these species, spectroscopic information on multiply deuterated isotopologs is often insufficient. In particular, searches for triply deuterated methanol, CD3OH, are hampered to a large extent by the lack of intensity information from a spectroscopic model. The aim of the present study is to develop a spectroscopic model of CD3OH in low-lying torsional states that is sufficiently accurate to facilitate further searches for CD3OH in space. We performed a new measurement campaign for CD3OH involving three spectroscopic laboratories that covers the 34 GHz−1.1 THz and the 20−900 cm−1 ranges. The analysis was performed using the torsion-rotation Hamiltonian model based on the rho-axis method. We determined a model that describes the ground and first excited torsional states of CD3OH, up to quantum numbers J ≤ 55 and Ka ≤ 23, and we derived a line list for radio-astronomical observations. The resulting line list is accurate up to at least 1.1 THz and should be sufficient for all types of radio-astronomical searches for this methanol isotopolog. This line list was used to search for CD3OH in data from the Protostellar Interferometric Line Survey of IRAS 16293−2422 using the Atacama Large Millimeter/submillimeter Array. Specifically, CD3OH is securely detected in the data, with a large number of clearly separated and well-reproduced lines. We not only detected lines belonging to the ground torsional state, but also several belonging to the first excited torsional state. The derived column density of CD3OH and abundance relative to the non-deuterated isotopolog confirm the significant enhancement of this multiply deuterated variant. This finding is in line with other observations of multiply deuterated complex organic molecules and may serve as an important constraint on their formation models.
Key words: molecular data / methods: laboratory: molecular / techniques: spectroscopic / radio lines: ISM / ISM: molecules / astrochemistry
Transition frequencies from this and earlier work and quantum numbers, uncertainties, and residuals between measured frequencies and those calculated from the final set of spectroscopic parameters are only available at the CDS via anonymous ftp to cdsarc.u-strasbg.fr (130.79.128.5) or via http://cdsarc.u-strasbg.fr/viz-bin/cat/J/A+A/658/A127
© ESO 2022
1 Introduction
Methanol, CH3OH, is among the very first molecules detected in space by means of radio astronomy (Ball et al. 1970). It is among the most abundant polyatomic molecules in the interstellar medium and is observed both in its solid state and gas phase toward star forming regions (e.g., Herbst & van Dishoeck 2009). It is an important product of the chemistry occurring on the icy surfaces of dust grains (e.g., Tielens & Hagen 1982; Garrod & Herbst 2006) and often taken as a reference for studies of the chemistry of more complex organic molecules (e.g., Jørgensen et al. 2020). Furthermore, as a slightly asymmetric rotor, whose excitation is strongly dependent on kinetic temperature, methanol presents a useful diagnostic tool for estimating the conditions present in star-forming regions (Leurini et al. 2004). In fact, CH3OH emission has been used to characterize physical conditions, for example, in Orion KL (Wang et al. 2011), Sagittarius B2(N2) (Müller et al. 2016), and the solar-type protostellar system IRAS 16293−2422 (Jørgensen et al. 2016).
The enrichment of deuterium in dense molecular clouds has been known for many years (Jefferts et al. 1973; Wilson et al. 1973), and explanations have been proposed nearly as far back as this (Millar et al. 1989). The singly deuterated methanol isotopomers, CH3OD (Mauersberger et al. 1988)and CH2DOH (Jacq et al. 1993), were detected first. Some time later, Parise et al. (2002) observed CHD2OH toward IRAS 16293−2422, followed by Parise et al. (2004) detecting CD3OH toward the same object. In addition, CHD2OH was also found toward the low-mass protostars IRAS 2, IRAS 4A, and IRAS 4B in the NGC 1333 molecular cloud (Parise et al. 2006).
The degree of deuteration has been considered an indicator of the evolution of low-mass star-forming regions (Crapsi et al. 2005; Ceccarelli et al. 2007; Chantzos et al. 2018). High degrees of deuteration were found in hot corinos, which are the warm and dense parts of low-mass star-forming regions, such as IRAS 16293−2422B (Jørgensen et al. 2018), the denser parts of the envelopes of low-mass star-forming regions, such as L483 (Agúndez et al. 2019), and even starless cores, such as TMC-1 (Burkhardt et al. 2018; Cernicharo et al. 2020; Cabezas et al. 2021) and L1544 (Spezzano et al. 2013). However, the deuterium enrichment is less pronounced in high-mass star-forming regions, such as NGC 6334I (Bøgelund et al. 2018), and even less if they reside in the Galactic center, such as Sagittarius B2(N2) (Belloche et al. 2016).
The high sensitivity of the Atacama Large Millimeter/submillimeter Array (ALMA) has made it possible to characterize the deuterium fractionation of various complex organic molecules comprehensively, for example, revealing some systematic differences between groups of species (e.g., Jørgensen et al. 2018). In particular, the data have made it possible to shed new light on the presence of multiply-deuterated variants (Persson et al. 2018)and allowed, for the first time, the identifications of doubly deuterated organics: methyl cyanide (CHD2CN; Calcutt et al. 2018), methyl formate (CHD2OCHO; Manigand et al. 2019), and dimethyl ether (CHD2OCH3; Richard et al. 2021) toward the low-mass protostellar system IRAS 16293−2422. These multi-deuterated variants appear overabundant compared to the D/H ratio inferred from the singly and non-deuterated species, similar to what has previously been inferred, and which may reflect their formation processes at low temperatures (Taquet et al. 2014). These multiply deuterated variants, with their high abundances, may be responsible for many prominent lines that are observable with ALMA toward solar-type protostars.
The rotational spectrum of CD3OH was studied already in the early days of microwave spectroscopy in the context of other methanol isotopologs, in particular, in order to determine the molecular structure (Venkateswarlu et al. 1955; Nishikawa 1956). Lees & Baker (1968) published the first extensive study of its rotational spectrum in the millimeter wave region by investigating the torsion-rotation interaction in the methanol isotopologs CH3OH, CD3OH, and CH3OD. Additional accounts on its rotational spectrum were published with infrared (Mollabashi et al. 1993a) and microwave accuracy (Baskakov & Pashaev 1992; Mollabashi et al. 1993b; Predoi-Cross et al. 1998). The latest of these studies also led to a thorough analysis of the CD3OH rotational spectrum in the ground and first excited torsional states (Walsh et al. 1998). In that study, the authors analyzed a dataset consisting of 472 microwave and 5320 far-infrared lines corresponding to transitions with J up to 20 and K up to 15 in the ground and first excited torsional states. The microwave part of the dataset covered the frequency range from 8 to 442 GHz, where all lines were assigned an uncertainty of 100 kHz or larger. The rovibrational spectrum of CD3OH was also examined in several studies, with Lees et al. (2015) being the most recent one to specifically deal with the in-plane rocking vibration.
The goal of our current study is to develop a spectroscopic model of CD3OH in low-lying torsional states sufficiently accurate to provide reliable calculations for astronomical searches for CD3OH in the interstellar medium. New measurements were carried out in broad frequency ranges extending the microwave dataset up to 1.1 THz. New far infrared measurements were carried out in addition in order to obtain more information on the torsional fundamental band. The rotational quantum number range coverage was extended to J = 55 and K = 23, and a fitwithin experimental uncertainties was obtained for the ground and first excited torsional states of the CD3OH molecule using the so-called rho-axis-method. We searched for CD3OH in the ALMA data of the Protostellar Interferometric Line Survey (PILS, Jørgensen et al. 2016) of the deeply embedded protostar IRAS 16293−2422 employing calculations of the rotational spectrum based on our results. CD3OH is confidently detected with a large number of unblended or slightly blended and well-reproduced lines.
The rest of the manuscript is organized as follows. Section 2 provides details on our laboratory measurements. The theoretical model, spectroscopic analysis, and fitting results are presented in Sects. 3 and 4. Section 5 describes our astronomical observations and the results of our search for CD3OH, while Sect. 6 gives the conclusions of our investigation.
2 Experimental details
2.1 Rotational spectra at IRA NASU
The measurements at the Institute of Radio Astronomy (IRA) of NASU were performed in the frequency ranges 34−183 GHz and 354−416 GHz using an automated millimeter wave spectrometer (Alekseev et al. 2012), built according to the so-called “classical” scheme of absorption spectrometers. The synthesis of the frequencies in the millimeter wave range is carried out by a two-step frequency multiplication of a reference synthesizer in two phase-lock-loop stages. At the second step of frequency multiplication, a set of backward wave oscillators is used to cover the frequency range from 34 to 183 GHz. Additional application of a solid state tripler from Virginia Diodes, Inc. (VDI) extended our measurements to the 354−416 GHz range. We used a commercial sample of CD3OH and all measurements were carried out at room temperature with sample pressures providing linewidths close to the Doppler limited resolution (about 2 Pa). Estimated uncertainties were 10 kHz, 30 kHz, and 100 kHz depending on the observed signal-to-noise ratios (S/N).
2.2 Rotational spectra at the Universität zu Köln
The measurements at the Universität zu Köln were recorded at room temperature using three different spectrometers. Pyrex glass cells of different lengths and with an inner diameter of 100 mm were employed. The cells were equipped with Teflon windows below 510 GHz, whereas high-density polyethylene was used at higher frequencies. All spectrometer systems used VDI frequency multipliers driven by Rohde & Schwarz SMF 100A microwave synthesizers as sources. Schottky diode detectors were utilized below 510 GHz, whereas a closed cycle liquid He-cooled InSb bolometer (QMC Instruments Ltd) was applied between 760 and ~1094 GHz. Frequency modulation was used throughout. The demodulation at 2f causes an isolated line to appear close to a second derivative of a Gaussian.
Two connected cells, each of 7 m in length, were used in a double pass arrangement at pressures of 2 Pa to cover 70−120 GHz; Ordu et al. (2012) provide additional details on this spectrometer. Figure 1 illustrates the sensitivity of this spectrometer. Alongside the Q-branch of CD3OH in the first excited torsional state, part of the same branch is shown for 13CD3OH in natural 13C/12C ratio.
A double pass cell of 5 m in length was used to cover 150−251 GHz, 249−375 GHz, and 375−505 GHz. The pressures were in the 2 Pa range for the 150−375 GHz regions and 1.5 Pa at 375−505 GHz. Further information on this spectrometer is available elsewhere (Martin-Drumel et al. 2015). We achieved frequency accuracies of 5 kHz with both spectrometers in a study of 2-cyanobutane (Müller et al. 2017) with a much richer rotational spectrum. We employed a setup with a 5 m single pass cell to cover 760 GHz to about 1094 GHz at pressures of ~1.5 Pa. Our studies on isotopic formaldehyde (Müller & Lewen 2017) or thioformaldehyde (Müller et al. 2019) demonstrate that accuracies of 10 kHz can be reached readily routinely for very symmetric lines with good signal-to-noise ratio (S/N). We assigned uncertainties of 10 kHz for the most precise measurements in our fits to accomodate possible measurement errors due to unresolved hyperfine structure caused by the nonzero electric quadrupole moment of the deuterium atoms; these errors may also be due to possible saturation distortions for strong lines. Other lines were given uncertainties of 20, 30, 50, 100, and 200 kHz, depending on the observed S/N and on the frequency range.
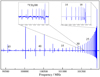 |
Fig. 1 Section of the millimeter spectrum of CD3OH displaying part of the vt = 1, K = 0 − 1 b-type Q-branch of E symmetry. Selected J quantum numbers are given above the lines. The right insert shows the origin on an expanded scale. The left insert depicts part of the corresponding branch of 13CD3OH with natural 12C/13C ratio. |
2.3 Far-infrared spectra at the Technische Universität Braunschweig
Measurements at the Technische Universität Braunschweig were performed with the Zürich prototype Fourier transform infrared spectrometer Bruker IFS125HR (Albert et al. 2011), which was slightly optimized to obtain the maximum nominal resolution for a nine-chamber system of 0.00096 cm−1. The resolution is defined as 1/dMOPD, with dMOPD standing forthe maximum optical path difference (Albert et al. 2011). Two pairs of records have been obtained for CD3OH using a stainless steel multireflection White cell at four paths, giving a total optical pathlength of 4.05 m. The 1.6 K Si bolometer of IRLabs was used in the spectral region of 20–700 cm−1, with a globar as radiation source, a 3.5 μm Mylar beam-splitter, and Teflon windows. A resolution of 0.003cm−1 was applied at sample pressures of 0.195 mbar and 1.0 mbar. A liquid-helium cooled germanium-copper (Ge:Cu) detector was applied in the spectral region of 350–900 cm−1. This detector was combined with an optical filter which is also liquid-helium cooled to optimize the noise in this spectral region. A globar radiation source, KBr beamsplitter, and CsI windows were used for recording the spectra of CD3OH with 0.00096 cm−1 resolution at sample pressures of 0.5 mbar and 1.0 mbar. In the current study, the 350–900 cm−1 record obtained at the sample pressure of 1.0 mbar and the 20–700 cm−1 record obtained at the sample pressure of 0.195 mbar were used. Both these spectra were calibrated with residual water lines, whose frequencies were taken from the HITRAN database (Gordon et al. 2017). Uncertainties of 0.0004 cm−1 were applied to the far-infrared (FIR) transition frequencies.
3 Spectroscopic properties of CD3OH and our theoretical approach
As one of the lightest and structurally simplest molecules that is capable of internal rotation, methanol may be designated, from a spectroscopic point of view, as the prime test case for theoretical models treating large amplitude torsional motion in molecules. Methanol is a nearly prolate top (κ ≈−0.982) that is characterized by a rather high coupling between internal and overall rotations in the molecule (ρ ≈ 0.81). In the case of the triply deuterated isotopolog CD3OH, the asymmetry parameter is nearly the same (κ ≈−0.977), whereas the coupling is slightly higher (ρ ≈ 0.89). The torsional potential barrier V3 is about 370 cm−1 for both CH3OH and CD3OH. The torsional splittings can reach tens of gigahertz even in the torsional ground state. The torsional problem may be considered as an intermediate barrier case (Lin & Swalen 1959) since s is ~6.0 for CH3OH and ~6.6 for CD3OH; here s = 4V3∕9F is the reduced barrier, where F is the rotation constant of the internal rotor. The torsional effects in CH3OH and CD3OH should be quite similar because of the similar values of s. However, we expect that rotational levels with higher J and K values will be accessible in a room temperature experiment for CD3OH compared to CH3OH because of the much smaller rotational parameters, A ≈ 2.36 cm−1, B ≈ 0.662 cm−1, C ≈ 0.642 cm−1 in CD3OH versus A ≈ 4.25 cm−1, B ≈ 0.823 cm−1, C ≈ 0.792 cm−1 in CH3OH (Xu et al. 2008).
In the current study, we aim to extend the previous analysis to the higher J levels, above the previously achieved limit of J ≤ 20 (Walsh et al. 1998), for the lowest torsional states of CD3OH. An analogous task was successfully fulfilled in the past for similar molecules such as acetaldehyde (CH3CHO; Smirnov et al. 2014) with ρ ≈ 0.33 and methyl mercaptan (CH3SH; Zakharenko et al. 2019), with ρ ≈ 0.65, where a high level of coupling between internal and overall rotations poses significant problems in treating torsion-rotation spectra. In particular, CD3OH, a molecule in which the coupling is further increased (ρ ≈ 0.89), represents a good testing case for available theoretical approaches and computer codes implementing those approaches.
The approach in the present study is the so-called rho-axis-method (RAM), which has proven to be the most effective approach so far in treating torsional large amplitude motions in methanol-like molecules. The method is based on the work of Kirtman (1962), Lees & Baker (1968), and Herbst et al. (1984). It takes its name from the choice of the axis system (Hougen et al. 1994), namely, the rho axis system, which is related to the principal axis system a, b, c by a rotation chosen to eliminate the − 2FρxpαJx and − 2FρypαJy coupling terms in the kinetic energy operator; here F is the internal rotation constant, pα is the internal rotation angular momentum, Jx and Jy are the usual x and y components of the global rotation angular momentum, and ρ is a vector that expresses the coupling between the angular momentum of the internal rotation pα and that of the global rotation J. The rotation to the RAM axis system corresponds to making the new z axis coincident with the ρ vector, thus making ρx = ρy = 0 by definition. The angle between the RAM a-axis and the principal-axis-method (PAM) a-axis is only 0.07° and 0.14° in CH3OH and CD3OH, respectively. Such a small angle in combination with the low asymmetry (κ ≈−0.98) means that the RAM a-axis in methanol should be suitable for the K quantization and that eigenvectors can be assigned unambiguously using the dominant basis set components.
We employed the RAM36 code (Ilyushin et al. 2010, 2013), which was successfully used in the past for a number of near prolate tops with rather high ρ and J values, such as acetaldehyde with ρ ≈ 0.33 and Jmax = 66 (Smirnov et al. 2014), methyl arsine with ρ ≈ 0.41 and Jmax = 50 (Motiyenko et al. 2020), and methyl mercaptan with ρ ≈ 0.65 and Jmax = 61 (Zakharenko et al. 2019). The code carries out the RAM approach for molecules with a C3v top attached to a molecular frame of Cs or C2v symmetry and having a threefold or sixfold barrier to internal rotation, respectively. The RAM36 code uses the two-step diagonalization procedure of Herbst et al. (1984). In the current study, we keep 31 torsional basis functions at the first diagonalization step and 11 torsional basis functions at the second diagonalization step. The labeling scheme after the second diagonalization step is based on an eigenfunction composition by searching for a dominant eigenvector component. The energy levels are labeled by the free rotor quantum number, m, the overall rotational angular momentum quantum number, J, and a signed value of Ka, which is the axial a-component of the overall rotational angular momentum J. In the case of the A symmetry species, the + ∕− sign corresponds to the so-called “parity” designation, which is related to the A1/A2 symmetry species in the group G6 (Hougen et al. 1994). The signed value of Ka for the E symmetry species reflects the fact that the Coriolis-type interaction between the internal rotation and the global rotation causes the |Ka| > 0 levels to split into a Ka > 0 level and a Ka < 0 level.
4 Spectroscopic results
We started our analysis from the results of Walsh et al. (1998). The dataset, consisting of 472 microwave and 5320 FIR transitions, ranging up to vt = 1, Jmax = 20, and Kmax = 15, was fit with 54 parameters of the RAM Hamiltonian, and a weighted standard deviation of 0.966 was achieved (Walsh et al. 1998). Unfortunately, we were able to recover only the microwave part of the dataset from this paper, which was presented in Tables 3a and 3b of Walsh et al. (1998). We refit the available microwave part of the CD3OH dataset with the RAM36 program (Ilyushin et al. 2010, 2013) as the first step; the BELGI code (Kleiner 2010) was used in the previous study (Walsh et al. 1998). The resulting fit was the starting point of our present investigation.
New data were assigned starting from the Kharkiv measurements in the 34–183 GHz frequency range. Transitions with J up to 49 have been assigned at this stage and the first transitions belonging to the second excited torsional state of CD3OH were assigned. The FIR records were analyzed subsequently on the basis of our new results. Submillimeter wave and THz measurements from Cologne and Kharkiv were assigned at the same time. The CD3OH THz spectrum is rather dense in parts, as can be seen in Fig. 2. The assignments for the three torsional states, namely: vt = 0, 1, and 2, were done in parallel. Whenever it was possible, we replaced the old measurements from Walsh et al. (1998) with the more accurate new ones. At the same time, we decided to keep in the fits two measured values for the same transition from the Kharkiv and Colognespectral recordings in those parts of the frequency range where the measurements from the two laboratories overlap (150−183 GHz and 354−416 GHz). We emphasize that a rather good agreement within the experimental uncertainties was observed for this limited set of duplicate measurements.
A search of the optimal set of RAM torsion-rotation parameters was carried out in parallel with the assignment process by testing different parameters up to an order of nop = 12; here, we employed the ordering scheme of Nakagawa et al. (1987). In the process of model refinement, it became evident rather soon that the vt = 2 torsional state poses significant problems with fitting. Although our understanding of the vt = 2 torsional state was qualitatively rather good (see Fig. 3, for example, comparing simulated and observed spectra for a part of the vt = 2 ← 0 torsional band), the best weighted root mean square deviation we could obtain for a combined fit of the vt = 0 to 2 CD3OH states with J up to 54 was aslarge as 4.4. The strong influence of intervibrational interactions arising from low lying small amplitude vibrations in the molecule, which then propagate down through numerous intertorsional interactions, is a possible explanation for these problems. Weber & Maker (1982) were the first to point out the possibility of Fermi resonances with high torsional levels for all methanol isotopologs, and a more recent overview of possible interactions with low lying small amplitude vibrations in CD3OH may be found in Lees et al. (2020). It is likely that the perturbations to vt = 2 levels could be on the order of a few hundredths of a cm−1, which is very substantial in terms of the fitting. Taking into account the astrophysical significance of methanol and its isotopologs, we decided subsequently to limit our fitting attempts mainly to the ground and first excited torsional states. Only the lowest three K series for the A and E species in vt = 2 were retained in order to constrain the torsional parameters in the Hamiltonian model better. These vt = 2 K levels are affected least by the intervibrational interactions arising from low lying small amplitude vibrations. This corresponds to K = −4, −1, 2 for the E species in vt = 2 and to K = −3, 0, 3 for the A species. We concentrated on assigning high K transitions in vt = 0 and 1 at the final stage of our analysis.
The final dataset in this work involves 7272 microwave and 5619 FIR line frequencies, which, as a result of blending, correspond to 15 798 transitions with Jmax = 55. A fit with a weighted root mean square (rms) deviation of 0.81 with 117 parameters included in the model (one fixed parameter) was chosen as our “best fit” for this paper. The quality of this fit can be seen in Table 1. The overall weighted rms deviation of 0.81 and the additional fact that all data groups are fit within experimental uncertainties seems satisfactory to us (see also the left part of Table 1 where the data are grouped by measurement uncertainty). The weighted rms deviations for the data grouped by torsional state also demonstrate a rather good agreement between our model and the experiment. It should be noted that absolute calibration of the FIR spectra against the frequencies of residual water impurity lines appeared to be important in achieving a fit within experimental error, especially for the most precise group of measurements with 10 kHz measurement uncertainty (at the initial stage of our model refinement, the FIR frequencies, obtained employing the original Bruker calibration, were used for the fitting). The 117 molecular parameters used in our final fit are given in Appendix B (Table B.1). The numbers of the terms in the model distributed between the orders nop = 2, 4, 6, 8, 10, 12 are 7, 22, 40, 34, 13, 1, respectively. This is consistent with the limits of determinable parameters of 7, 22, 50, 95, 161, and 252 for these orders, as calculated from the differences between the total number of symmetry-allowed Hamiltonian terms of order nop and the number of symmetry-allowed contact transformation terms of order nop − 1 (again we apply here the ordering scheme of Nakagawa et al. 1987).
We decided to fix the V9 parameter in the final fit to improve the convergence of the fit. The fit with V9 varied was still converging with respect to the relative change in the weighted rms deviation of the fit at the last iteration, but the corrections to some of the parameters values were as large as ~10−1 of their confidence intervals in the last iteration and concomitant changes in the calculated transition frequencies exceeded 1 kHz for some transitions. However, we generally expect the ratio usually to be about 10−3 to 10−4 for a “good” convergence, and changes in the calculated transition frequencies are usually below 1 kHz even for FIR data. The V9 parameter is larger than V6 in magnitude, as shown in Appendix B (Table B.1), indicating that the expansion of the torsional potential function is far from a smooth convergence. As was discussed previously for methyl mercaptan (Zakharenko et al. 2019), such behavior of the torsional potential function may be attributed to intervibrational interactions with low-lying small amplitude vibrational modes in the molecule. This may also be a reason for our convergence problems if V9 is varied because the fit attempts to account for perturbations by varying a number of parameters, but the Hamiltonian terms needed to account explicitly for the perturbations are not yet built in our present model; this, in turn, leads to a high correlation among some parameters and V9. Omitting V9 from our model was not an option because this would lead to a significant increase in the weighted rms deviation of the fit. Therefore, we decided to keep V9 fixed to a value we obtained from our last best fit with V9 varied, and then truncated to the number of significant digits provided by that fit.
We calculated a list of CD3OH transitions in the ground and first excited torsional states for astronomical observations using the parameters of our final fit. We employed the dipole moment function of Mekhtiev et al. (1999) in our calculations, where the values for the permanent dipole moment components were replaced by μa = 0.9080(9) D and μb = 1.4378(10) D. These values were determined for 13CD3OH from Stark effect measurements (Mukhopadhyay & Sastry 2015a), but based on the similarity between 12CH3OH (Mukhopadhyay & Sastry 2015b) and 13CH3OH (Sastry et al. 1994) dipole moment components, we believe that these are the best estimates available for 12CD3OH. The permanent dipole moment components were rotated from the principal axis system to the rho axis system of our Hamiltonian model. As seen from Fig. 4, this choice of dipole moment components provides an opportunity to reproduce the observed intensity pattern of the CD3OH spectrum rather well. The list of CD3OH transitions includes information on transition quantum numbers, transition frequencies, calculated uncertainties, lower state energies, and transition strengths. Since extrapolation beyond the quantum number coverage of a given experimental dataset becomes rapidly unreliable, especially in the case of molecules with large amplitude motions, we chose a torsional state limit of vt ≤ 1 and rotational limits of J ≤ 60 and |Ka|≤ 24. We label the torsion-rotation levels by the free rotor quantum number, m, the overall rotational angular momentum quantum number, J, and a signed value of Ka, as mentioned earlier in this work. We also provide Kc values for convenience, but they are recalculated from the J and Ka values, Kc = J −|Ka| for Ka ≥ 0 and Kc = J −|Ka| + 1 for Ka < 0. The m values of 0, −3 / 1, −2 correspond to A/E transitions of the vt = 0 and 1 torsional states, respectively. The calculations were truncated above 1.3 THz. Additionally, we limited our calculations to transitions for which the uncertainties are less than 0.1 MHz. The lower-state energies are given in reference to the Ka = 0 A-type vt = 0 level, calculated to be 124.1663857823 cm−1 above the bottom of the torsional potential well. In addition we provide the torsion-rotation part of the partition function Qrt (T) of CD3OH calculated from first principles, that is, via direct summation over the torsion-rotational states. The maximum J value is 100 and  torsional states were taken into account. The calculations, as well as the experimental line list from the present work, is available at the CDS.
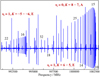 |
Fig. 2 Section of the submillimeter spectrum of CD3OH. Parts of two narrow b-type Q-branches are presented with designations and selected J quantum numbers above the lines. Also shown is a weaker and wider Q-branch with designations and selected J quantum numbers below the lines. |
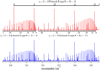 |
Fig. 3 Portion of the CD3OH FIR spectrum dominated by one R-branch and two Q-branches of the vt = 2 ← 0 band in the 519.5−525.5 cm−1 range. The observed spectrum is shown in the lower panel and the calculated one in the upper panel. The experimental frequencies and the intensity pattern are rather well reproduced by our model for the spectral features dominating this frequency range. Assignments of lower state J quantum numbers are given at the top and the bottom of the upper panel for these branches. |
Overview of the dataset and the fit quality.
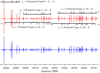 |
Fig. 4 Portion of the CD3OH microwave spectrum dominated by one vt = 0 Q-branch and two R-branches from the vt = 1, 2 excited torsional states in the 388.75−389.55 GHz range. The observed spectrum is shown in the lower panel and the calculated one in the upper panel. The experimental frequencies and the intensity pattern are rather well reproduced by our model for the spectral features dominating this frequency range, although for some vt = 2 E type transitions (see e.g., K = 4, J = 10 ← 9 transition near 388 859 MHz), there are noticeable shifts in frequency with respect to our predictions. The J and selected K quantum numbers are given at the top and the bottom of the upper panel for the dominant spectral branches. We note that for A type transitions of the R branches the K quantum number stands for a degenerate pair of K± transitions in all cases except K = 0,1,2,2- in the vt = 1 state and K = 0 in the vt = 2 state. |
5 Astronomical search for CD3OH
The new spectroscopic calculations were used to search for lines of CD3OH in data from the Protostellar Interferometric Line Survey (PILS). As described in Jørgensen et al. (2016), the core of PILS is an unbiased survey of the Class 0 protostellar system IRAS 16293−2422 using ALMA at frequencies between 329 and 363 GHz (the main atmospheric window of ALMA’s Band 7). The data image the spectral lines toward the multiple sources in the region with an angular resolution of ~0.5″ and a spectral resolution of ~0.2 km s−1. Toward one specific region that is slightly offset from the “B” component of the system (IRAS16293B in the following), the lines are narrow, ~1 km s−1, and with thesensitivity of the ALMA data ~10 000 individual lines can be identified − including many complex organic molecules and their isotopologs (see, e.g., Jørgensen et al. 2016, 2018; Calcutt et al. 2018; Manigand et al. 2020). This includes a number of new detections toward solar-type protostars or in the interstellar medium overall.
The search was conducted in a similar manner as for other complex organics in the PILS survey by fitting synthetic spectra to the PILS data. Such synthetic spectra are calculated assuming that the excitation of the molecule is characterized by local thermodynamical equilibrium (LTE), which is reasonable at the densities on the scales probed by PILS (Jørgensen et al. 2016). Furthermore, a common velocity offset relative to the local standard of rest is adopted (2.6 km s−1) and the lines are fit with a similar width (1 km s−1; FWHM). We focus in the analysis on lines that are optically thin (fitted values of τ < 0.2 km s−1), leaving the kinetic temperature and column density of the species as the two free parameters. Figure 5 (upper panel) shows an example of a fit to a prominent subset of vt = 0 lines at 351.5 GHz and Figs. A.1–A.6 illustrate fits to the 48 lines calculated to be strongest while having τ < 0.2. We also detected several unblended or only slightly blended transitions pertaining to the vt = 1 torsional state. Figure 5 (lower panel) shows an example of a fit to a prominent subset of vt = 1 lines at 350.6 GHz (see also Figs. A.7–A.9). The best fit corresponds to an excitation temperature of 225 K for a CD3OH column density of 3.1 × 1016 cm−2. Varying the excitation temperature from 200 to 250 K does not change the quality of the fits significantly and results in column densities of 2.8 × 10¹⁶ to 3.2 × 1016 cm−2. The lowest excitation lines (Eup < 100 K) may be tracing a potentially more extended, cold foreground layer (Jørgensen et al. 2018). If those lines are excluded, a reasonable fit can be obtained for temperatures up to 300 K with a column density of 3.7 × 1016 cm−2. CD3OH is securely detected in the data at a high level of confidence with a number of clearly separated and well-reproduced lines. Furthermore, the strengths seen for a rather high number of transitions surpass many of the transitions of rarer species as well as their isotopologs (see, e.g., examples in Jørgensen et al. 2018), highlighting the importance of the spectroscopic properties of the isotopic variants of molecules such as methanol.
We obtained a CD3OH/CH3OH ratio of ~0.33% from this column density and that of CH3OH, which was estimated from optically thin lines of CH OH (Jørgensen et al. 2016, 2018). If all substitution reactions of deuterium in CH3OH were equally probable (e.g., Parise et al. 2004; Manigand et al. 2019), this CD3OH/CH3OH ratio would imply a D/H ratio of 15%. This ratio is about a factor of 7 higher than the D/H ratios inferred from measuring the singly deuterated (CH2DOH and CH3OD) isotopologs relative to the main isotopolog but in line with the enhancements seen in the doubly deuterated variants of methyl formate (CH3OHCHO; Manigand et al. 2019) and dimethyl ether (CH3OCH3; Richard et al. 2021). Thus, this result lends further support to the idea that the enhanced D/H ratios of the multi-deuterated complex organics are inherited from the precursor molecules that are formed as the outer ice mantles of interstellar dust grains late in the protostellar evolution when the gas-phase [D]/[H] abundance is the highest (e.g., Taquet et al. 2014, 2019). However, it should be noted that the measured abundance ratios of CD3OH relative to CH3OH are still significantly above those predicted in the models by Taquet et al. (2014) of ~0.01%, while the abundances of the singly deuterated to non-deuterated methanol species were found to be in better agreement with model predictions (Jørgensen et al. 2018; Taquet et al. 2019).
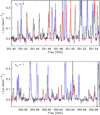 |
Fig. 5 Example set of prominent vt = 0 (upper panel) and vt = 1 (lower panel) CD3OH transitions in data of the ALMA PILS program toward a position slightly offset from the “B” component of IRAS 16293−2422. The black line shows the observed spectrum extracted toward the position, the red line corresponds to the best fit synthetic spectrum model for the CD3OH transitions and the blue line presents the fits to other species identified within PILS. |
6 Conclusion
In this work, we performed a new study of the torsion-rotation spectrum of CD3OH isotopolog using a torsion-rotation RAM Hamiltonian. The new microwave measurements carried out in broad frequency ranges from 34 GHz to 1.1 THz were augmented by new FIR measurements. Transitions with J up to 55 and Ka up to 23 involving the vt = 0, 1, 2 torsional states were assigned and analyzed. After revealing perturbations in the second excited torsional state of CD3OH, presumably caused by the intervibrational interactions arising from low-lying small-amplitude vibrations in this molecule, we concentrated our efforts on refining the theoretical model for the ground and first excited torsional states only. A fit within the experimental uncertainties (weighted rms deviation 0.81) was achieved for the dataset consisting of 7272 microwave and 5619 FIR line frequencies.
Calculations of the ground and first excited torsional states were carried out for astronomical observations that were based on these results. These calculations were used in a search for CD3OH spectral features in data from the ALMA PILS survey of the deeply embedded protostar IRAS 16293−2422. We detected CD3OH confidently in the data with a large number of clearly separated and well-reproduced lines. A CD3OH excitation temperature of 225 K was derived from the best fit, yielding a column density of 3.1 × 1016 cm−2. A comparison of this result to the column density of the CH3OH main isotopolog deduced from optically thin lines of CH OH yields a CD3OH/CH3OH ratio as highas ~0.33%, implying that the triply deuterated variant is significantly enhanced compared to the D/H ratio inferred by comparing the singly and non-deuterated variants.
Acknowledgements
We acknowledge support by the Deutsche Forschungsgemeinschaft via the collaborative research center SFB 956 (project ID 184018867) project B3 as well as the Gerätezentrum SCHL 341/15-1 (“Cologne Center for Terahertz Spectroscopy”). The research in Kharkiv and Braunschweig was carried out under support of the Volkswagen foundation. The assistance of the Science and Technology Center in the Ukraine is acknowledged (STCU partner project P756). J.K.J. is supported by the Independent Research Fund Denmark (grant number 0135-00123B). R.M.L. received support from the Natural Sciences and Engineering Research Council of Canada. Our research benefited from NASA’s Astrophysics Data System (ADS). This paper makes use of the following ALMA data: ADS/JAO.ALMA#2013.1.00278.S. ALMA is a partnership of ESO (representing its member states), NSF (USA) and NINS (Japan), together with NRC (Canada), MOST and ASIAA (Taiwan), and KASI (Republic of Korea), in cooperation with the Republic of Chile. The Joint ALMA Observatory is operated by ESO, AUI/NRAO and NAOJ.
Note added in proofs. The V6ab3 parameter in Table B.1 should be multiplied by  operator to give a correct term used in the final Hamiltonian instead of
  .
.
Appendix A Fits to CD3OH transitions in the ALMA data
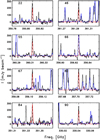 |
Fig. A.1 Fits to the 48 transitions of CD3OH in the ALMA data predicted to be the strongest while having τ < 0.2 from the model described in Sect. 5: the model for CD3OH is shown in red and the combined model for other species identified in PILS in blue. The spectra are sorted according to the energy of the upper level above the ground-state, indicated in the upper left corner of each plot. |
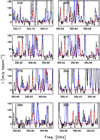 |
Fig. A.7 Fits to the vt = 1 transitions of CD3OH in the ALMA data predicted to be the strongest from the model described in Sect. 5: the model for CD3OH is shown in red and the combined model for other species identified in PILS in blue. The spectra are sorted according to the energy of the upper level above the ground-state, indicated in the upper left corner of each plot. |
Appendix B Parameters of the RAM Hamiltonian for the CD3OH molecule
Fitted parameters of the RAM Hamiltonian for the CD3OH molecule
References
- Agúndez, M., Marcelino, N., Cernicharo, J., Roueff, E., & Tafalla, M. 2019, A&A, 625, A147 [Google Scholar]
- Albert, S., Keppler Albert, K., & Quack, M. 2011, Handbook of High Resolution Spectroscopy (Hoboken: Wiley), 2, 965 [Google Scholar]
- Alekseev, E. A., Motiyenko, R. A., & Margules, L. 2012, Rad. Phys. Rad. Astron., 3, 75 [NASA ADS] [CrossRef] [Google Scholar]
- Ball, J. A., Gottlieb, C. A., Lilley, A. E., & Radford, H. E. 1970, ApJ, 162, L203 [NASA ADS] [CrossRef] [Google Scholar]
- Baskakov, O. I., & Pashaev, M. A. O. 1992, J. Mol. Spectrosc., 151, 282 [NASA ADS] [CrossRef] [Google Scholar]
- Belloche, A., Müller, H. S. P., Garrod, R. T., & Menten, K. M. 2016, A&A, 587, A91 [NASA ADS] [CrossRef] [EDP Sciences] [Google Scholar]
- Bøgelund, E. G., McGuire, B. A., Ligterink, N. F. W., et al. 2018, A&A, 615, A88 [Google Scholar]
- Burkhardt, A. M., Herbst, E., Kalenskii, S. V., et al. 2018, MNRAS, 474, 5068 [NASA ADS] [CrossRef] [Google Scholar]
- Cabezas, C., Endo, Y., Roueff, E., et al. 2021, A&A, 646, L1 [NASA ADS] [CrossRef] [EDP Sciences] [Google Scholar]
- Calcutt, H., Jørgensen, J. K., Müller, H. S. P., et al. 2018, A&A, 616, A90 [NASA ADS] [CrossRef] [EDP Sciences] [Google Scholar]
- Ceccarelli, C., Caselli, P., Herbst, E., Tielens, A. G. G. M., & Caux, E. 2007, in Protostars and Planets V, eds. B. Reipurth, D. Jewitt, & K. Keil (Tucson: University of Arizona Press), 47 [Google Scholar]
- Cernicharo, J., Marcelino, N., Agúndez, M., et al. 2020, A&A, 642, L8 [NASA ADS] [CrossRef] [EDP Sciences] [Google Scholar]
- Chantzos, J., Spezzano, S., Caselli, P., et al. 2018, ApJ, 863, 126 [CrossRef] [Google Scholar]
- Crapsi, A., Caselli, P., Walmsley, C. M., et al. 2005, ApJ, 619, 379 [Google Scholar]
- Garrod, R. T., & Herbst, E. 2006, A&A, 457, 927 [NASA ADS] [CrossRef] [EDP Sciences] [Google Scholar]
- Gordon, I. E., Rothman, L. S., Hill, C., et al. 2017, J. Quant. Spectr. Rad. Transf., 203, 3 [Google Scholar]
- Herbst, E., & van Dishoeck, E. F. 2009, ARA&A, 47, 427 [NASA ADS] [CrossRef] [Google Scholar]
- Herbst, E., Messer, J. K., DeLucia, F. C., & Helminger, P. 1984, J. Mol. Spectr., 108, 42 [NASA ADS] [CrossRef] [Google Scholar]
- Hougen, J. T., Kleiner, I., & Godefroid, M. 1994, J. Mol. Spectr., 163, 559 [Google Scholar]
- Ilyushin, V. V., Kisiel, Z., Pszczókowski, L., Mäder, H., & Hougen, J. T. 2010, J. Mol. Spectrosc., 259, 26 [NASA ADS] [CrossRef] [Google Scholar]
- Ilyushin, V. V., Endres, C. P., Lewen, F., Schlemmer, S., & Drouin, B. J. 2013, J. Mol. Spectr., 290, 31 [NASA ADS] [CrossRef] [Google Scholar]
- Jacq, T., Walmsley, C. M., Mauersberger, R., et al. 1993, A&A, 271, 276 [NASA ADS] [Google Scholar]
- Jefferts, K. B., Penzias, A. A., & Wilson, R. W. 1973, ApJ, 179, L57 [NASA ADS] [CrossRef] [Google Scholar]
- Jørgensen, J. K., van der Wiel, M. H. D., Coutens, A., et al. 2016, A&A, 595, A117 [Google Scholar]
- Jørgensen, J. K., Müller, H. S. P., Calcutt, H., et al. 2018, A&A, 620, A170 [Google Scholar]
- Jørgensen, J. K., Belloche, A., & Garrod, R. T. 2020, ARA&A, 58, 727 [Google Scholar]
- Kirtman, B. 1962, J. Chem. Phys., 37, 2516 [NASA ADS] [CrossRef] [Google Scholar]
- Kleiner, I. 2010, J. Mol. Spectr., 260, 1 [NASA ADS] [CrossRef] [Google Scholar]
- Lees, R. M., & Baker, J. G. 1968, J. Chem. Phys., 48, 5299 [NASA ADS] [CrossRef] [Google Scholar]
- Lees, R. M., Xu, L.-H., Gao, S., & Billinghurst, B. E. 2015, J. Mol. Spectr., 315, 63 [NASA ADS] [CrossRef] [Google Scholar]
- Lees, R. M., Xu, L.-H., & Billinghurst, B. E. 2020, J. Mol. Struct., 1209, 127960 [NASA ADS] [CrossRef] [Google Scholar]
- Leurini, S., Schilke, P., Menten, K. M., et al. 2004, A&A, 422, 573 [NASA ADS] [CrossRef] [EDP Sciences] [Google Scholar]
- Lin, C. C., & Swalen, J. D. 1959, Rev. Mod. Phys., 31, 841 [NASA ADS] [CrossRef] [Google Scholar]
- Manigand, S., Calcutt, H., Jørgensen, J. K., et al. 2019, A&A, 623, A69 [NASA ADS] [CrossRef] [EDP Sciences] [Google Scholar]
- Manigand, S., Jørgensen, J. K., Calcutt, H., et al. 2020, A&A, 635, A48 [NASA ADS] [CrossRef] [EDP Sciences] [Google Scholar]
- Martin-Drumel, M. A., van Wijngaarden, J., Zingsheim, O., et al. 2015, J. Mol. Spectr., 307, 33 [Google Scholar]
- Mauersberger, R., Henkel, C., Jacq, T., & Walmsley, C. M. 1988, A&A, 194, L1 [NASA ADS] [Google Scholar]
- Mekhtiev, M. A., Godfrey, P. D., & Hougen, J. T. 1999, J. Mol. Spectr., 194, 171 [NASA ADS] [CrossRef] [Google Scholar]
- Millar, T. J., Bennett, A., & Herbst, E. 1989, ApJ, 340, 906 [NASA ADS] [CrossRef] [Google Scholar]
- Mollabashi, M., Lees, R. M., & Johns, J. W. C. 1993a, Int. J. Infrared Millimeter Waves, 14, 1727 [CrossRef] [Google Scholar]
- Mollabashi, M., Lees, R. M., Xu, L.-H., & Bakota, M. 1993b, Int. J. Infrared Millimeter Waves, 14, 2569 [NASA ADS] [CrossRef] [Google Scholar]
- Motiyenko, R., Ilyushin, V., Demaison, J., et al. 2020, J. Mol. Struct., 1213, 128037 [NASA ADS] [CrossRef] [Google Scholar]
- Mukhopadhyay, I., & Sastry, K. V. L. N. 2015a, J. Mol. Struct., 1098, 119 [NASA ADS] [CrossRef] [Google Scholar]
- Mukhopadhyay, I., & Sastry, K. V. L. N. 2015b, J. Mol. Spectr., 312, 51 [NASA ADS] [CrossRef] [Google Scholar]
- Müller, H. S. P., & Lewen, F. 2017, J. Mol. Spectr., 331, 28 [CrossRef] [Google Scholar]
- Müller, H. S. P., Belloche, A., Xu, L.-H., et al. 2016, A&A, 587, A92 [NASA ADS] [CrossRef] [EDP Sciences] [Google Scholar]
- Müller, H. S. P., Zingsheim, O., Wehres, N., et al. 2017, J. Phys. Chem. A, 121, 7121 [Google Scholar]
- Müller, H. S. P., Maeda, A., Thorwirth, S., et al. 2019, A&A, 621, A143 [NASA ADS] [CrossRef] [EDP Sciences] [Google Scholar]
- Nakagawa, K., Tsunekawa, S., & Kojima, T. 1987, J. Mol. Spectr., 126, 329 [NASA ADS] [CrossRef] [Google Scholar]
- Nishikawa, T. 1956, J. Phys. Soc. Japan, 11, 781 [NASA ADS] [CrossRef] [Google Scholar]
- Ordu, M. H., Müller, H. S. P., Walters, A., et al. 2012, A&A, 541, A121 [NASA ADS] [CrossRef] [EDP Sciences] [Google Scholar]
- Parise, B., Ceccarelli, C., Tielens, A. G. G. M., et al. 2002, A&A, 393, L49 [NASA ADS] [CrossRef] [EDP Sciences] [Google Scholar]
- Parise, B., Castets, A., Herbst, E., et al. 2004, A&A, 416, 159 [NASA ADS] [CrossRef] [EDP Sciences] [Google Scholar]
- Parise, B., Ceccarelli, C., Tielens, A. G. G. M., et al. 2006, A&A, 453, 949 [NASA ADS] [CrossRef] [EDP Sciences] [Google Scholar]
- Persson, M. V., Jørgensen, J. K., Müller, H. S. P., et al. 2018, A&A, 610, A54 [NASA ADS] [CrossRef] [EDP Sciences] [Google Scholar]
- Predoi-Cross, A., Xu, L.-H., Walsh, M. S., et al. 1998, J. Mol. Spectr., 188, 94 [NASA ADS] [CrossRef] [Google Scholar]
- Richard, C., Jørgensen, J. K., Margulès, L., et al. 2021, A&A, 651, A120 [NASA ADS] [CrossRef] [EDP Sciences] [Google Scholar]
- Sastry, K. V. L. N., Vanderlinde, J., Donovan, D., Mukhopadhyay, I., & Gupta, P. K. 1994, J. Mol. Spectr., 168, 374 [NASA ADS] [CrossRef] [Google Scholar]
- Smirnov, I. A., Alekseev, E. A., Ilyushin, V. V., et al. 2014, J. Mol. Spectr., 295, 44 [NASA ADS] [CrossRef] [Google Scholar]
- Spezzano, S., Brünken, S., Schilke, P., et al. 2013, ApJ, 769, L19 [Google Scholar]
- Taquet, V., Charnley, S. B., & Sipilä, O. 2014, ApJ, 791, 1 [NASA ADS] [CrossRef] [Google Scholar]
- Taquet, V., Bianchi, E., Codella, C., et al. 2019, A&A, 632, A19 [NASA ADS] [CrossRef] [EDP Sciences] [Google Scholar]
- Tielens, A. G. G. M., & Hagen, W. 1982, A&A, 114, 245 [Google Scholar]
- Venkateswarlu, P., Edwards, H. D., & Gordy, W. 1955, J. Chem. Phys., 23, 1195 [NASA ADS] [CrossRef] [Google Scholar]
- Walsh, M. S., Xu, L.-H., & Lees, R. M. 1998, J. Mol. Spectr., 188, 85 [NASA ADS] [CrossRef] [Google Scholar]
- Wang, S., Bergin, E. A., Crockett, N. R., et al. 2011, A&A, 527, A95 [NASA ADS] [CrossRef] [EDP Sciences] [Google Scholar]
- Weber, W. H., & Maker, P. D. 1982, J. Mol. Spectr., 93, 131 [NASA ADS] [CrossRef] [Google Scholar]
- Wilson, R. W., Penzias, A. A., Jefferts, K. B., & Solomon, P. M. 1973, ApJ, 179, L107 [NASA ADS] [CrossRef] [Google Scholar]
- Xu, L.-H., Fisher, J., Lees, R. M., et al. 2008, J. Mol. Spectr., 251, 305 [NASA ADS] [CrossRef] [Google Scholar]
- Zakharenko, O., Ilyushin, V. V., Lewen, F., et al. 2019, A&A, 629, A73 [NASA ADS] [CrossRef] [EDP Sciences] [Google Scholar]
All Tables
All Figures
|
Fig. 1 Section of the millimeter spectrum of CD3OH displaying part of the vt = 1, K = 0 − 1 b-type Q-branch of E symmetry. Selected J quantum numbers are given above the lines. The right insert shows the origin on an expanded scale. The left insert depicts part of the corresponding branch of 13CD3OH with natural 12C/13C ratio. |
| In the text | |
|
Fig. 2 Section of the submillimeter spectrum of CD3OH. Parts of two narrow b-type Q-branches are presented with designations and selected J quantum numbers above the lines. Also shown is a weaker and wider Q-branch with designations and selected J quantum numbers below the lines. |
| In the text | |
|
Fig. 3 Portion of the CD3OH FIR spectrum dominated by one R-branch and two Q-branches of the vt = 2 ← 0 band in the 519.5−525.5 cm−1 range. The observed spectrum is shown in the lower panel and the calculated one in the upper panel. The experimental frequencies and the intensity pattern are rather well reproduced by our model for the spectral features dominating this frequency range. Assignments of lower state J quantum numbers are given at the top and the bottom of the upper panel for these branches. |
| In the text | |
|
Fig. 4 Portion of the CD3OH microwave spectrum dominated by one vt = 0 Q-branch and two R-branches from the vt = 1, 2 excited torsional states in the 388.75−389.55 GHz range. The observed spectrum is shown in the lower panel and the calculated one in the upper panel. The experimental frequencies and the intensity pattern are rather well reproduced by our model for the spectral features dominating this frequency range, although for some vt = 2 E type transitions (see e.g., K = 4, J = 10 ← 9 transition near 388 859 MHz), there are noticeable shifts in frequency with respect to our predictions. The J and selected K quantum numbers are given at the top and the bottom of the upper panel for the dominant spectral branches. We note that for A type transitions of the R branches the K quantum number stands for a degenerate pair of K± transitions in all cases except K = 0,1,2,2- in the vt = 1 state and K = 0 in the vt = 2 state. |
| In the text | |
|
Fig. 5 Example set of prominent vt = 0 (upper panel) and vt = 1 (lower panel) CD3OH transitions in data of the ALMA PILS program toward a position slightly offset from the “B” component of IRAS 16293−2422. The black line shows the observed spectrum extracted toward the position, the red line corresponds to the best fit synthetic spectrum model for the CD3OH transitions and the blue line presents the fits to other species identified within PILS. |
| In the text | |
|
Fig. A.1 Fits to the 48 transitions of CD3OH in the ALMA data predicted to be the strongest while having τ < 0.2 from the model described in Sect. 5: the model for CD3OH is shown in red and the combined model for other species identified in PILS in blue. The spectra are sorted according to the energy of the upper level above the ground-state, indicated in the upper left corner of each plot. |
| In the text | |
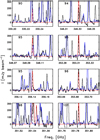 |
Fig. A.2 Fits to CD3OH continued – as in Fig. A.1. |
| In the text | |
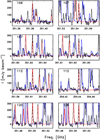 |
Fig. A.3 Fits to CD3OH continued – as in Fig. A.1. |
| In the text | |
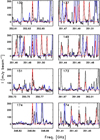 |
Fig. A.4 Fits to CD3OH continued – as in Fig. A.1. |
| In the text | |
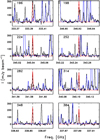 |
Fig. A.5 Fits to CD3OH continued – as in Fig. A.1. |
| In the text | |
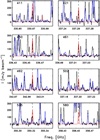 |
Fig. A.6 Fits to CD3OH continued – as in Fig. A.1. |
| In the text | |
|
Fig. A.7 Fits to the vt = 1 transitions of CD3OH in the ALMA data predicted to be the strongest from the model described in Sect. 5: the model for CD3OH is shown in red and the combined model for other species identified in PILS in blue. The spectra are sorted according to the energy of the upper level above the ground-state, indicated in the upper left corner of each plot. |
| In the text | |
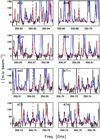 |
Fig. A.8 Fits to CD3OH continued – as in Fig. A.7. |
| In the text | |
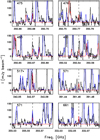 |
Fig. A.9 Fits to CD3OH continued – as in Fig. A.7. |
| In the text | |
Current usage metrics show cumulative count of Article Views (full-text article views including HTML views, PDF and ePub downloads, according to the available data) and Abstracts Views on Vision4Press platform.
Data correspond to usage on the plateform after 2015. The current usage metrics is available 48-96 hours after online publication and is updated daily on week days.
Initial download of the metrics may take a while.