Fig. A.1
Download original image
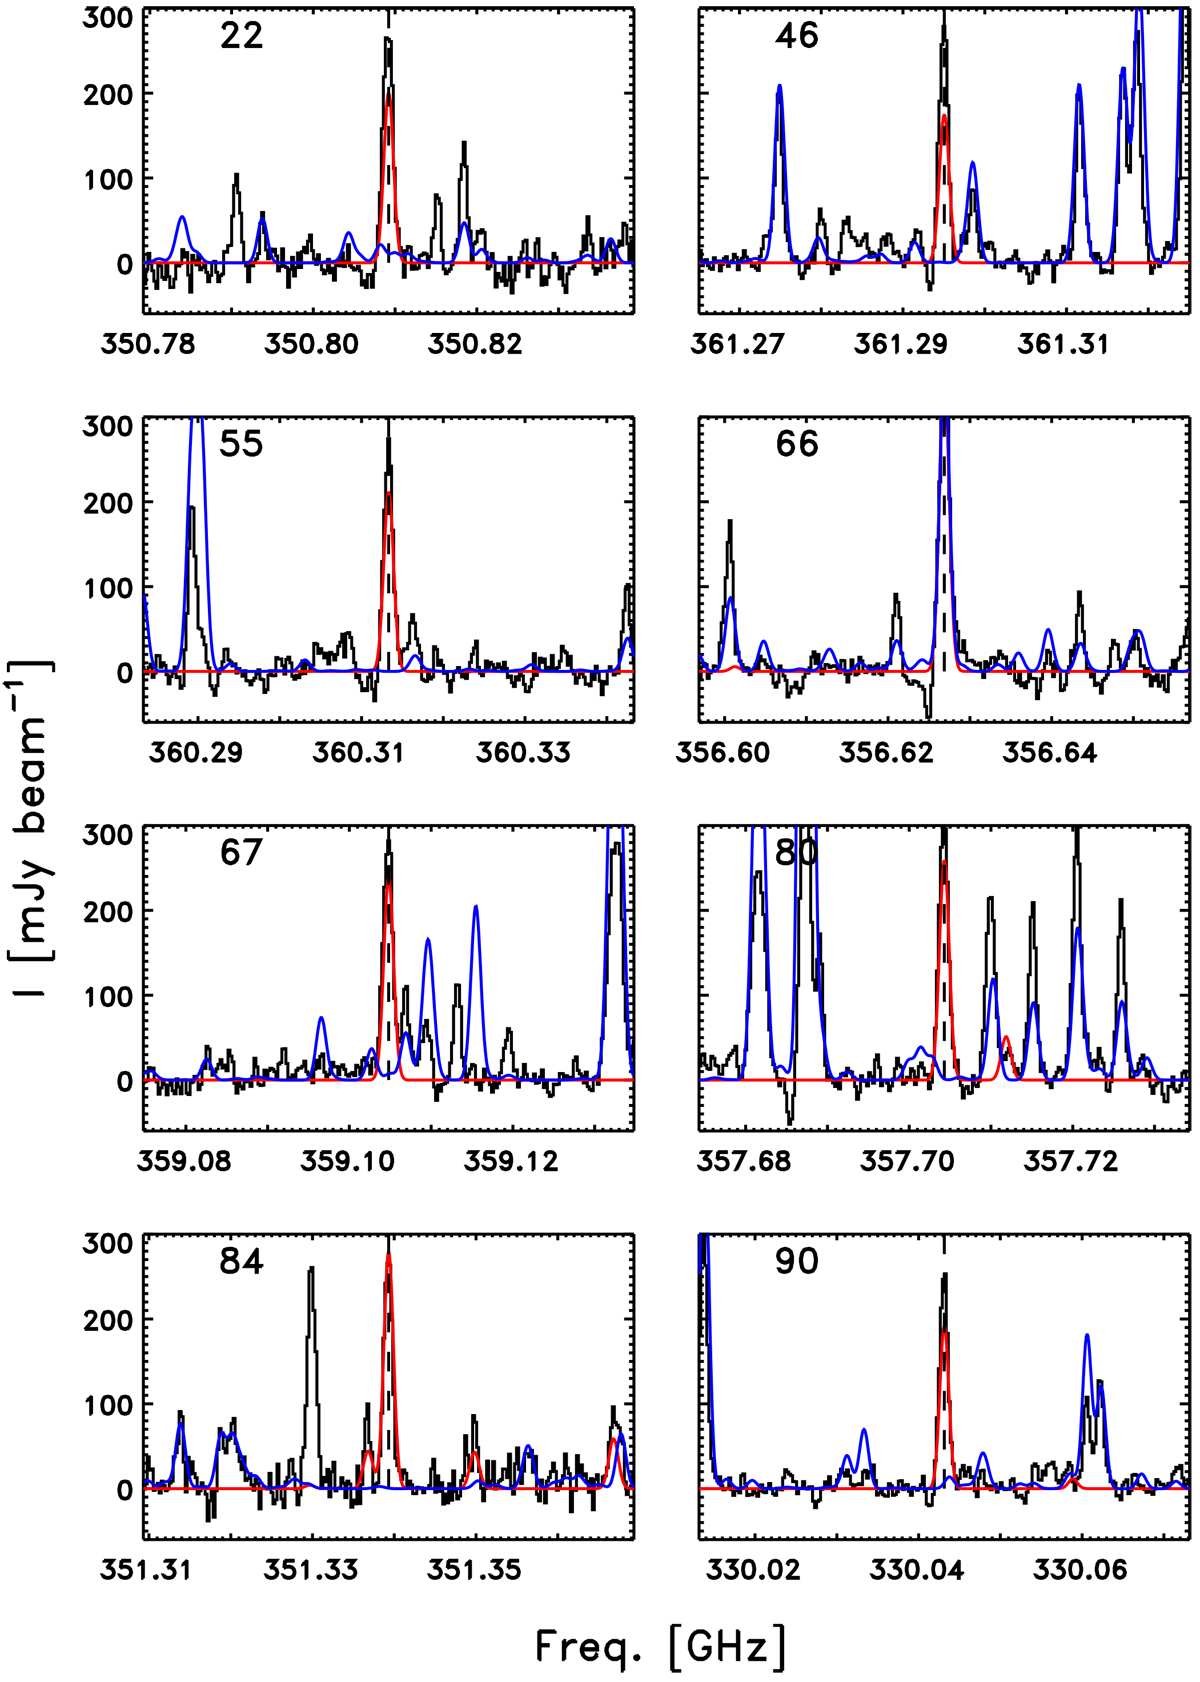
Fits to the 48 transitions of CD3OH in the ALMA data predicted to be the strongest while having τ < 0.2 from the model described in Sect. 5: the model for CD3OH is shown in red and the combined model for other species identified in PILS in blue. The spectra are sorted according to the energy of the upper level above the ground-state, indicated in the upper left corner of each plot.
Current usage metrics show cumulative count of Article Views (full-text article views including HTML views, PDF and ePub downloads, according to the available data) and Abstracts Views on Vision4Press platform.
Data correspond to usage on the plateform after 2015. The current usage metrics is available 48-96 hours after online publication and is updated daily on week days.
Initial download of the metrics may take a while.