Fig. 1
Download original image
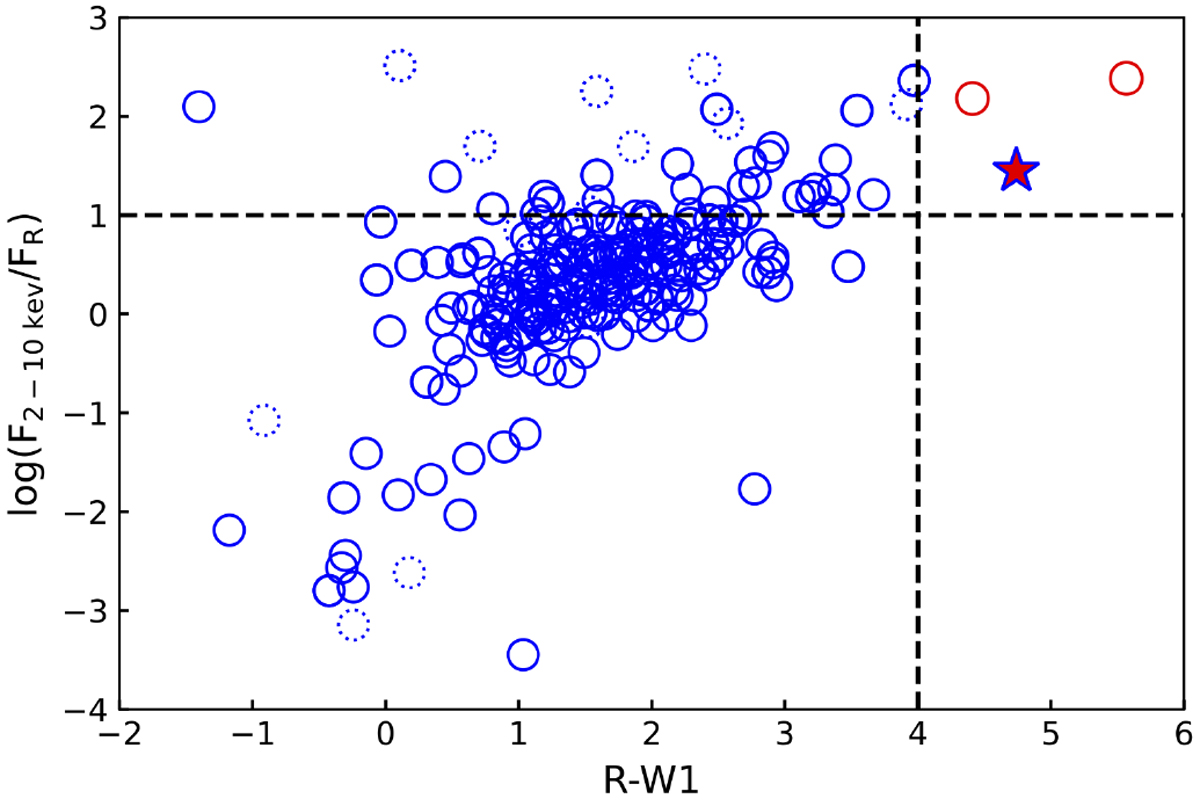
Diagnostic diagram used to isolate QSO candidates in the feedback phase: X-ray to optical flux ratio vs. r-Wl colours for all the 246 eFEDS sources detected in the hard band in the eFEDS sample. Red points mark sources in the selection locus for the windy QSOs at r-Wl > 4 and log X/O > 1 (upper right corner). Blue points mark all other sources. Sources with less reliable counterparts in the hard X-ray sample are marked with dotted lines. Source XID439 is marked by a large red star.
Current usage metrics show cumulative count of Article Views (full-text article views including HTML views, PDF and ePub downloads, according to the available data) and Abstracts Views on Vision4Press platform.
Data correspond to usage on the plateform after 2015. The current usage metrics is available 48-96 hours after online publication and is updated daily on week days.
Initial download of the metrics may take a while.