| Issue |
A&A
Volume 661, May 2022
The Early Data Release of eROSITA and Mikhail Pavlinsky ART-XC on the SRG mission
|
|
|---|---|---|
| Article Number | A9 | |
| Number of page(s) | 11 | |
| Section | Extragalactic astronomy | |
| DOI | https://doi.org/10.1051/0004-6361/202141092 | |
| Published online | 18 May 2022 | |
The eROSITA Final Equatorial-Depth Survey (eFEDS)
The first archetypal quasar in the feedback phase discovered by eROSITA
1
Dipartimento di Fisica e Astronomia “Augusto Righi”, Università di Bologna,
via Gobetti 93/2,
40129
Bologna,
Italy
e-mail: This email address is being protected from spambots. You need JavaScript enabled to view it.
2
INAF – Osservatorio di Astrofisica e Scienza dello Spazio di Bologna,
via Gobetti 93/3,
40129
Bologna,
Italy
3
Leibniz-Institut für Astrophysik Potsdam (AIP),
An der Sternwarte 16,
14482
Potsdam,
Germany
4
Department of Astronomy, Kyoto University,
Kitashirakawa-Oiwake-cho, Sakyo-ku,
Kyoto
606-8502,
Japan
5
Academia Sinica Institute of Astronomy and Astrophysics,
11F of Astronomy-Mathematics Building, AS/NTU, No. 1, Section 4, Roosevelt Road,
Taipei
10617,
Taiwan
6
Research Center for Space and Cosmic Evolution, Ehime University,
2–5 Bunkyo-cho, Matsuyama,
Ehime
790-8577,
Japan
7
Max Planck Institut für Extraterrestrische Physik,
Giessenbachstrasse 1,
85748
Garching bei München,
Germany
8
CAS Key Laboratory for Research in Galaxies and Cosmology, Department of Astronomy, University of Science and Technology of China,
Hefei
230026,
PR China
9
Kavli Institute for the Physics and Mathematics of the Universe (WPI), The University of Tokyo,
Kashiwa,
Chiba
277-8583,
Japan
10
School of Astronomy and Space Science, University of Science and Technology of China,
Hefei
230026,
PR China
11
Centro de Astrobiología, (CAB, CSIC-INTA), Departamento de Astrofisica,
Cra. de Ajalvir Km. 4,
28850
Torrejón de Ardoz,
Madrid,
Spain
12
INAF – Osservatorio Astrofisico di Arcetri,
Largo Enrico Fermi 5,
50125
Firenze,
Italy
13
Exzellenzcluster ORIGINS,
Boltzmannstr. 2,
85748
Garching,
Germany
14
Institute for Astronomy and Astrophysics, National Observatory of Athens,
V. Paulou and I. Metaxa,
11532
Greece
15
Department of Astrophysical Sciences, Princeton University,
Princeton,
NJ
08544,
USA
16
National Astronomical Observatory of Japan,
Mitaka,
Tokyo
181-8588,
Japan
17
Graduate School of Science and Engineering, Ehime University,
2-5 Bunkyo-cho,
Matsuyama,
Ehime
790-8577,
Japan
Received:
15
April
2021
Accepted:
30
June
2021
Abstract
Theoretical models of the co-evolution of galaxies and active galactic nuclei (AGNs) ascribe an important role in the feedback process to a short, luminous, obscured, and dust-enshrouded phase during which the accretion rate of the supermassive black hole is expected to be at its maximum and the associated AGN-driven winds are also predicted to be maximally developed. To test this scenario, we have isolated a textbook candidate from the eROSITA Final Equatorial-Depth Survey (eFEDS) obtained within the performance and verification program of the eROSITA telescope on board the Spectrum Röntgen Gamma mission. From an initial catalogue of 246 hard X-ray selected sources that are matched with the photometric and spectroscopic information available within the eROSITA and Hyper Suprime-Cam consortia, three candidates quasars in the feedback phase have been isolated applying a diagnostic proposed previously. Only one source (eFEDS J091157.4+014327) has a spectrum already available (from SDSS-DR16, z = 0.603) and it unambiguously shows abroad component (full width at half maximum ~1650 kms−1) in the [OIII]5007 line. The associated observed L[OIII] is ~2.6 × 1042 erg s−1, one to two orders of magnitude higher than that observed in local Seyfert galaxies and comparable to those observed in a sample of z ~ 0.5 type 1 quasars. From the multi-wavelength data available, we derive an Eddington ratio (Lbol/LEdd) of ~0.25 and a bolometric correction in the hard X-ray band of kbol ~ 10, which is lower than the corrections observed for objects at similar bolometric luminosity. These properties, along with the outflow, the high X-ray luminosity, the moderate X-ray obscuration (LX∽1044.8 erg s−1, NH∽2.7 × 1022 cm−2), and the red optical colour, all match the prediction of quasars in the feedback phase from merger-driven models. Forecasting to the full eROSITA all-sky survey with its spectroscopic follow-up, we predict that by the end of 2024, we will have a sample of few hundred such objects at z= 0.5–2.
Key words: galaxies: active / X-rays: general / X-rays: individuals: eFEDS J091157.4+014327 / ISM: jets and outflows
© ESO 2022
1 Introduction
Since the discovery of supermassive black holes (SMBH, 106−1010 M⊙) in the nuclei of virtually all galaxies and of the relations observed in the local Universe between host and black hole (BH) properties (e.g. Kormendy & Ho 2013), it has become clear that the formation and evolution of galaxies and the properties of these massive dark objects sitting in their centre are profoundly coupled. Some mechanism must therefore have linked the innermost regions, in which the SMBH gravitational field dominates, to the larger scales, where its effect is expected to be negligible. It has been proposed that gas flows in the form of energetic jets or winds play a pivotal role in this process (see King & Pounds 2015 for a review). Their presence may regulate both accretion and ejection of material onto and from compact objects, and the gas accelerated by the radiation pressure from the accretion disc in rapidly accreting sources interacts with the interstellar medium (ISM) of the host galaxy, propagating momentum and energy over wide spatial scales. This provides an efficient feedback mechanism (e.g. Zubovas & King 2012). The details of this coupling are key ingredients in all models of active galactic nuclei (AGN) and galaxy co-evolution.
The outflows developing in AGN host galaxies have a multiphase nature, as expected from simulations and revealed by observations (see Cicone et al. 2018 for a recent summary). Although ionised outflows can be signalled by broad and shifted or asymmetric wings in the [OIII]5007 emission line, as seen in integrated spectra (e.g. Mullaney et al. 2013; Brusa et al. 2015; Zakamska et al. 2016), in the past decade, high-resolution observations with high signal-to-noise ratios made with integral field units (IFU; MUSE, KMOS, and SINFONI, among others) of AGN winds mostly at low redshift (e.g. Harrison et al. 2014; Venturi et al. 2018; Ramos Almeida et al. 2019) have played a crucial role in uncovering their extent (radius) and kinematics properties (velocity and geometry), which are key parameters for deriving the mass outflow rates  and energetics
  . These fast-moving gas components observed at kiloparsec scale or beyond show substantial velocities (v ~ 1000–3000kms−1) and mass outflow rates as high as 100–1000 M⊙ yr−1 (see Fiore et al. 2017; Rupke et al. 2017, for reviews and compilations). The main limitation in this type of studies beyond the local Universe is still the paucity of targets that are bright enough in the optical/near-infrared (NIR) band for the underlying physics and kinematics of systemic and outflowing gas to be spatially resolved and studied in great detail (see e.g. Cresci et al. 2015, Brusa et al. 2016).
Theoretical models ascribe an important role to a radiatively driven process associated with a short, luminous, and dust-enshrouded phase (the so-called blow-out phase, e.g. Hopkins et al. 2008; Fabian 2012) during which the SMBH accretion is indeed expected to be at its maximum (high L/LEdd; e.g. Urrutia et al. 2012, where the reddest quasars show the highest Eddington ratio). This phase follows a heavily obscured, possibly Compton-thick phase of rapid black hole growth. In the past two decades, mid-infrared and sub-millimeter surveys have proven to be especially efficient in selecting obscured quasars that are not biased against Compton-thick sources and therefore have a complete sampling of AGN, including those in the first heavily obscured phase (e.g. Lacy et al. 2004; Stern et al. 2005; Alexander et al. 2005; Martínez-Sansigre et al. 2006; Daddi et al. 2007; Dey et al. 2008; Lanzuisi et al. 2009; Donley et al. 2012; Assef et al. 2015). However, these samples may be contaminated by the host-galaxy light, and in some cases, the AGN nature needed to be validated by an X-ray stacking analysis (e.g. Fiore et al. 2009) or dedicated X-ray observations (e.g. Stern et al. 2014; Piconcelli et al. 2015). Because the blow-out phase is expected to be only mildly obscured in the X-rays (see e.g. Hopkins et al. 2008; Blecha et al. 2018), large-area hard X-ray surveys with the associated high-quality, multi-wavelength data are probably the best tool to select these very rare sources. They simultaneously provide information on the nuclear obscuration, on the AGN accretion rate (e.g. LX/M⋆), and on the unambiguous fingerprint of ongoing AGN activity.
The lack of a sensitive all-sky X-ray survey essential to provide statistically significant samples of these rare obscured quasi-stellar objects (QSOs) will be overcome in the immediate future by eROSITA (extended ROentgen Survey with an Imaging Telescope Array, Predehl et al. 2021), an X-ray telescope on board the Spectrum Röntgen Gamma (SRG) satellite and in full operation since December 2019. In addition to the most sensitive 0.2–2.3 keV all-sky survey (Merloni et al. 2012), eROSITA provides the first true imaging all-sky survey in the hard band (2.3–5 keV) through an unprecedented combination of a large field of view and spectral and angular resolution. We present the discovery of an obscured quasar showing a powerful ionised outflow from eROSITA performance and verification (PV) phase observations, an assessment of the selection of these rare objects in the context of available samples of objects caught in the feedback phase at similar redshifts, and predictions for the final eROSITA all-sky survey. We adopt the cosmological parameters H0 = 70 kms−1 Mpc−1, Ωm = 0.3, and ΩΛ = 0.7 (Spergel et al. 2003) throughout the paper. When quoting magnitudes, the AB system is used unless otherwise stated. We adopt a Chabrier initial mass function to derive stellar masses and star formation rates (SFRs) for the target and comparison samples. Errors are given at 1 σ. At the redshift of the source, the physical scale is 1′′ ~ 6.8 kpc.
2 Parent sample, target selection, and properties
The unique eROSITA survey science capabilities have been tested with the PV program eFEDS (eROSITA Final Equatorial-Depth Survey; Brunner et al. 2022), a mini-survey reaching the average depth of the all-sky survey over ~1/350 of the sky in the survey footprint of the Hyper Suprime-Cam (HSC: Miyazaki et al. 2018) Subaru Strategic Program (HSC-SSP: Aihara et al. 2018a,b, 2019). We started from the catalogue of 246 X-ray point-like sources selected in the 2.3–5 keV band (Brunner et al. 2022), imposing a threshold in detection likelihood >10, corresponding to fewer than 10% of spurious sources in the field, as assessed on the basis of extensive simulations described in Liu et al. (2022). Salvato et al. (2022) provided the counterpart identification for all point-like X-rays sources in eFEDS, a reliability flag for the association, and all the photometry for the proposed counterparts over the entire range of wavelengths from the ultraviolet (UV; GALEX) to the mid-infrared (MIR; WISE W4). We refer to Salvato et al. (2022) for all the relevant details on the association process and description of the photometry, and to Nandra et al. (in prep.) for a full characterisation of the hard sample in terms of its X-ray and multi-wavelength properties. For this work, we note that a total of 231 out of 246 sources in the hard sample have reliable optical identifications, and the remaining 15 out of 246 may be spurious associations. Photometry in the r band (from Legacy Survey LS8 data) and W1 (from WISE) is available for all of them.
In order to select QSO candidates in the feedback phase, we applied a diagnostic similar to that proposed in Brusa et al. (2015), which was tested over the 2deg2 area of the XMM-COSMOS survey (Hasinger et al. 2007; Brusa et al. 2010). In detail, we imposed a colour selection based on the NIR to optical flux ratio (r-W1> 4) and on the X-ray to optical flux ratio (logX/O > 1, where “X” is the 2–10keV flux1 and “O” is the r-band flux; see Brusa et al. 2010, 2015 for a detailed discussion), and we isolated three such sources. Figure 1 shows the diagnostic diagram with all the sources from the eFEDS hard sample and the selection locus. Solid and dashed symbols denote reliable and less reliable associations, respectively.
Of these three eROSITA objects, a spectroscopic redshift is so far available only for one source from SDSS DR16 (Lyke et al. 2020), eFEDS J091157.4+014327 at z = 0.603 (XID439 in the eFEDS Hard band catalogue, shown as a red star in Fig. 1; Nandra et al., in prep.).
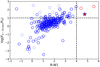 |
Fig. 1 Diagnostic diagram used to isolate QSO candidates in the feedback phase: X-ray to optical flux ratio vs. r-Wl colours for all the 246 eFEDS sources detected in the hard band in the eFEDS sample. Red points mark sources in the selection locus for the windy QSOs at r-Wl > 4 and log X/O > 1 (upper right corner). Blue points mark all other sources. Sources with less reliable counterparts in the hard X-ray sample are marked with dotted lines. Source XID439 is marked by a large red star. |
2.1 X-ray spectrum
A Bayesian spectral analysis with automatic background fitting (Simmonds et al. 2018) was performed on the eROSITA spectra extracted in the 0.2-10 keV bands of all the eFEDS point-like sources with BXA (Buchner et al. 2014), which connects XSPEC (Arnaud 1996) with the UltraNest2 nested-sampling algorithm (Buchner 2016, 2019). Several models were adopted (a single and double power-law model, a thermal model, and for the sources with the lowest statistics, models with a fixed photon index). All the details of the spectral fitting are reported in Liu et al. 2022. The benefit of nested sampling includes an automatic characterisation of all posterior modes, measurement of the uncertainties and multi-variate degeneracies, automatic identification of its convergence, and Bayesian model comparison of different models. A main benefit for large surveys is that nested sampling can be run unsupervised on each source, regardless of spectral quality, and produces homogeneous output products.
Figure 2 shows the eROSITA total and background spectra, with the best-fit model of an absorbed power law at the redshift of the source. Adopting a uniform prior for the slope and a logarithmic prior for NH, the best-fit photon index and column density are  and NH = 2.75 + 0.65 × 1022 cm−2.
We also fit the X-ray spectrum with an absorbed thermal model at the redshift of the source (tbabs*apec), which returned a best-fit temperature of kT~3.5keV and a column density of ~8 × 1021 cm−2, with a statistical significance similar to the absorbed power-law fit. However, these physical properties are hardly justified when compared to other properties of the system (see Sect. 2.2). We therefore consider that the absorbed power-law model reproduces our data best.
The intrinsic 2-10 keV luminosity from the best-fit model is  . From an X-ray point of view, the source is therefore classified as an obscured QSO, confirming the effectiveness of the selection criterion in revealing these rare systems.
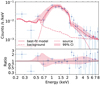 |
Fig. 2 eROSITA spectrum of XID439 (blue points). The source, background, and source + background models are superposed as labelled. Bottom panel: ratio of data to the best-fit model. |
2.2 Host galaxy properties
The HSC grz colour image is shown in the top panel of Fig. 3. XID439 is the bright red source located at the centre (r = 20.74). An apparent over-density of sources is visible around the target, including a close-by fainter (r = 22.53) object at 0.5−1′′ in the NW direction, possibly signalling an ongoing merger.
The observed X-ray fluxes for XID439 are well above the confusion limit expected for eROSITA in the soft and hard band (~2× 10⁻¹⁵ergcm−2 s−1 and ~l× 10−14ergcm−2 s−1, respectively; see Kolodzig et al. 2013). We can therefore argue that the observed X-ray emission is not the superposition of two sources. Moreover, the point-like classification in the eROSITA catalogue and the hard X-ray spectrum reasonably exclude that the observed X-ray emission could be attributed to hot gas emission in a galaxy group. This is also confirmed by the fact that the best-fit thermal model returns a best-fit temperature of 3.5 keV (see Sect. 2.1), which is significantly higher than the temperature expected for galaxy groups (kT < 3 keV; e.g. Eckmiller et al. 2011). The best-fit thermal model also requires a high column density, which is hard to physically motivate in extended source emission.
From the broadband optical and NIR photometry available from HSC and WISE (Wright et al. 2010), we were able to decompose the nuclear and host galaxy emission (following the method presented in Liu et al. 2022). The point source is detected in all HSC bands, but the overall emission is dominated by the host galaxy (with a ratio of host-to-total flux of ~80%), with a half-light radius of re = 1.4arcsec (~9.5kpc). The bottom panel of Fig. 3 shows the HSC data in the I band and the results of the host-galaxy/AGN decomposition (see caption for details). After accounting for the host-galaxy and point-like emission, residual emission on scales of about 1′′ in the central region of the galaxy are still present (rightmost panel in Fig. 3).
We ran X-CIGALE (Boquien et al. 2019; Yang et al. 2020) on the entire SED, including the MIR and FIR data points and upper limits and the X-ray eROSITA fluxes. The parameter set-up for our reference model is illustrated in Appendix A, and it is the same as was used for the fit of the WISE-selected sources in the eFEDS field (Toba et al. 2022).
The stellar mass is constrained to be M* = 4.4 ± 1.4 × 10¹¹ M⊙, and for the SFR, we retrieve SFR = 62 ± 20 M⊙ yr−1, although this is weakly constrained due to the upper limits in the Herschel bands (see Fig. A.1 and the discussion in the appendix). The galaxy is not classified as a starburst galaxy, but it might be classified as a main-sequence or sub-main-sequence galaxy at its redshift.
We also estimated the 6 μm luminosity contributed from AGN to be  in the same manner as Toba et al. (2019a). If we assume an empirical relation between
  and L2−10 ke V (Chen et al. 2017), the expected
  , consistent with the value obtained from our X-ray spectral fitting (Sect. 2.1). This is a further independent confirmation that the X-ray flux may be associated with the point-like AGN.
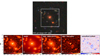 |
Fig. 3 Top panel: HSC colour image (band: grz) of the windy QSO XID439. The cutout size is ~25′′ on side. The dashed rectangle highlights the area in which the host galaxy-AGN decomposition was performed. Bottom panel: host galaxy-AGN decomposition on Subaru i-band data. The panels from left to right are a zoom in the central area of the top panel (dashed rectangle, ~10′′ in size) as follows: (1) observed HSC i-band image, (2) best-fit point source + galaxy model, (3) data minus the point source model (i.e., the pure-galaxy image), (4) data minus the galaxy model (i.e. the pure-AGN image); and (5) fitting residual divided by the variance map. In all panels, north is up and east is left. |
3 Results
3.1 Ionised outflow
The SDSS spectrum3 is shown in Fig. 4a, compared with templates of type 1 and type 2 AGN (Vanden Berk et al. 2001; Yuan et al. 2016). The type 2 template appears to fit the overall spectrum (continuum and lines) reasonably well. We note that a similar fit can be obtained with a considerable extinction, E(B − V) ~ 0.6, applied to the type 1 template (see Urrutia et al. 2009). A NIR spectrum sampling the Hα would be key to distinguishing the two scenarios.
The spectrum unambiguously shows broad [O III]4959,5007 lines: a non-parametric analysis returns a total line profile width of w80 = 1560 km s−1, significantly larger than the median value of <w80>med ~ 700 km s−1 obtained for the type 2 quasar sample from SDSS presented in Yuan et al. (2016).
In order to further constrain the line properties, we performed a multi-component Gaussian fit, which required two Gaussian lines with a full width at half maximum (FWHM) ~400 km s−1 and FWHM ~ 1650km s−1, respectively. Figure 4b shows a close-up of the Hβ and [O III]4959,5007 region, where the two components are shown separately. The two-component fit was preferred over the one-component fit (which would return an FWHM = 1080 km s−1) on the basis of the Bayesian information criterion (Schwarz 1978). The broad component is slightly redshifted (~100 kms−1). Although less frequent than the blueshifted cases, redshifted outflows are still common in type 2 AGN samples showing disturbed [OIII] kinematics (e.g. Bae & Woo 2014; Yuan et al. 2016; Perna et al. 2017).
A combination of two Gaussian lines with the same widths and shifts as fit the [OIII]4959,5007 doublet can also reproduce the weak Hβ4861 emission. In this scenario, the broad component seen in Hβ can therefore be associated with an ionised wind rather than to motion in the broad line region (BLR). This indicates a type 1.9–2 nature for this source.
The observed luminosity associated with the outflowing broad component ![Mathematical equation: ${L_{\left[{{\rm{OIII}}} \right]{\rm{,broad}}}}\,{\rm{is}}\,{\rm{\~}}\,{\rm{2}}{\rm{.6}} \times {\rm{1}}{{\rm{0}}^{{\rm{42}}}}\,{\rm{erg}}{{\rm{s}}^{- {\rm{1}}}}$](/articles/aa/full_html/2022/05/aa41092-21/aa41092-21-eq8.png) , one to two orders of magnitude higher than that observed with IFU in local Seyferts (e.g. MAGNUM and CARS samples; Mingozzi et al. 2019; Powell et al. 2018) and comparable to that observed in a sample of z ~ 0.5 type 1 QSOs (e.g. Husemann et al. 2016).
, one to two orders of magnitude higher than that observed with IFU in local Seyferts (e.g. MAGNUM and CARS samples; Mingozzi et al. 2019; Powell et al. 2018) and comparable to that observed in a sample of z ~ 0.5 type 1 QSOs (e.g. Husemann et al. 2016).
Following Fiore et al. (2017), we computed the ionised gas-mass outflow rate  assuming vout = ΔV + 2σbroad ~ 1400 km s−1 as the outflow velocity, the observed luminosity of the broad [OIII] component, and adopting for the electron density of the medium a value of ne = 500 cm−3 (see also Kakkad et al. 2020). For the spatial extension of the outflow, we assumed Rout ~ 10 kpc, corresponding to the half-light radius measured from HSC. We obtain
  , where the
  uncertainties are obtained adopting a Monte Carlo approach, following Marasco et al. (2020; see Appendix B). This mass outflow rate should be considered as a lower limit given that no correction for extinction has been adopted, and we assumed the entire galaxy scale as spatial extension. Because the mass outflow rate is directly proportional to the observed luminosity and inversely proportional to the extension (see Eqs. (B.2) and (B.3) in Fiore et al. 2017), the mass outflow rate can be up to ~2 orders of magnitudes higher when it is confined only within the central 1 kpc and assuming a correction of 10 for the extinction.
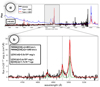 |
Fig. 4 SDSS spectrum of XID439 (panel a) from ~5000 to ~ 10 000 Å. The templates of type 1 and type 2 AGN are superimposed as labelled, highlighting the significant reddening of XID439 and its likely type 2 nature. A close-in zoom of the Hβ+[OIII] lines complex is shown (panel b) with the two-Gaussian best-fit decomposition. |
3.2 AGN properties and Eddington ratio
Kim et al. (2015) reported an estimate of the bolometric luminosity  , BH mass
  and Eddington ratio
  for XID439, as derived from the Paβ line in the framework of NIR spectroscopic follow-up of the sample of red QSOs presented in Urrutia et al. (2009). We derived a more accurate estimate of the bolometric luminosity from the SED fitting with X-CIGALE, obtaining
  (see also Appendix A), a factor of ~2 lower than the value reported in Kim et al. (2015). This translates into a correspondingly lower estimate for the Eddington ratio, Lbol/LEdd = 0 25.
This value is more than one order of magnitude higher than the value Lbol/LEdd ~ 0.01 that was inferred for the X-ray selected AGN population at z ~ 0.5-1.0 as reported in Georgakakis et al. (2017) and calculated from the ratio between the X-ray luminosity and the host galaxy stellar mass (known as the specific accretion rate, see also Brusa et al. 2009), after assuming the bolometric correction of the X-ray and the bolometric luminosity  and the MBH/M* ratio (MBH ~ 0.002 × M*, e.g. Marconi & Hunt 2003)4. This is further confirmation that XID439 is experiencing a peculiar phase and that it has been caught close to the most active, accreting phase. We note, however, that the high observed value is mostly due to the high X-ray luminosity of XID439. When we further downselect all AGN with LX > 10445 erg s−1 (higher than the eFEDS limit) in the same redshift range, we obtain a consistent value
  . On the other hand, the population of sources with
  has a significantly lower luminosity
  and stellar mass
  than those observed in XID439 on average, which indicates that the proposed selection is efficient in isolating massive, highly accreting SMBHs.
All properties discussed in the text and derived from the data presented in this work are listed in Table 1.
4 Discussion
XID439 satisfies several selection criteria that were used in the past to isolate obscured QSOs. It has been reported for the first time in the sample of 229 optical type 2 QSOs at z < 0.83 from the SDSS survey on the basis of a high [OIII]5007/Hβ flux ratio (Zamaska et al. 2003; see also Reyes et al. 2008). The sample was subsequently enlarged by Yuan et al. (2016) and contains 2920 type 2 QSOs out to z ~ 15. Forty-three out of 2920 objects fall within the eFEDS footprint. Of these, only two are significantly detected by eROSITA in the 2.3–5 keV band. The detected sources increase to 6 when the full (0.2–5 keV selected) eROSITA catalogue is considered. XID439 has the highest luminosity in X-rays, and it alone has a line width (w80, see Sect. 3) >800 kms−1. We did not reveal significant X-ray emission in the eROSITA stacking of the remaining undetected 37 sources at an average redshift of z ~ 0.5 (see Appendix C for details). This corresponds to an average 2–10 keV luminosity lower than ~2 × 1043 erg s−1 (unless all these objects are heavily obscured). The average hard X-ray luminosity is consistent with that expected for type 2 Seyfert galaxies of comparable [OIII] luminosities (L[OIII] ~5× 1042ergs−1), according to the LX–L[OIII] relation of Heckman et al. (2005).
Our target is also part of the FIRST-2MASS (F2MS) sample of 122 radio-selected QSOs with red colours (R-K > 4.5 and J-K > 1.3) presented in Urrutia et al. (2009; F2MS 0911+0143). Only four objects from this sample fall within the eFEDS footprint. XID439 alone is detected by eROSITA in the hard band. It has a peak flux at 1.4 GHz of 4.5 mJy as measured from FIRST (Becker et al. 1995), where it remains unresolved. It is not a strongly jetted source, and its radio-loudness parameter, R, is < 10, so that it is classified as a radio-quiet source, with a spectral index of −0.74 between 1.4 and 0.325 GHz (Mauch et al. 2013). The radio power of L14GHz ~ 1025 WHz−1 and the steep spectral index would classify XID439 as a compact steep-spectrum radio source, which is expected to be an intrinsically young source (e.g. Fanti et al. 1995). This again indicates that XID439 may be caught in an early stage of its evolution.
Finally, XID439 is part of the Wide and Deep Exploration of Radio Galaxies with Subaru HSC (WERGs Yamashita et al. 2018) sample presented in Toba et al. (2019b), which contains 1056 radio galaxies at z < 1.7 selected from FIRST and matched with HSC down to g ~ 26, with accurate SED fitting6. The eFEDS footprint contains 425 sources: this number is considerably larger than the numbers listed above, given that no further optical-to-infrared colour pre-selection has been applied to the sample. Ichikawa et al. (in prep.) report the complete analysis of the X-ray properties of WERGS in eFEDS.
The red QSOs selections and the WERGS survey have revealed optically faint radio galaxies and proved to be particularly effective in selecting the AGN population with a high Eddington ratio based on observed source properties (e.g. colour and/or flux cuts). Our selection based on a combination of X-ray to optical and optical to NIR colours is similarly very effective in detecting these highly accreting obscured sources. Although initially proposed in a relatively small sky area such as COSMOS observed with XMM-Newton (Brusa et al. 2010; see also LaMassa et al. 2016 for an extension to Stripe82), we verified that it can also be applied at much brighter fluxes and on samples extracted from the eROSITA hard X-ray surveys. The only source (out of three candidate outflowing QSOs) with an available optical spectrum, XID439, is an X-ray type 2 QSO with a robustly constrained L/LEdd = 0.25 from accurate SED fitting and available BH mass (Sect. 3.2).
Although XID439 was part of several samples in the past from optical or radio selections (all based on an all-sky survey area or in an area covered by the SDSS footprint, at least), it has never before been followed-up in the X-rays. eROSITA therefore provides the first X-ray observation of this object, and it confirms its prominent X-ray luminosity and obscuration (NH > 1022 cm−2). We note that the other two sources in the outflowing locus are also X-ray obscured with NH > 1022 cm−2 and intrinsic L2-10keV ~ 1044.5,45.5 ergs−1 when the photometric redshifts are considered, zphot = 0.8, 2.2 (Liu et al. 2022). Moderate X-ray obscuration in the Compton-thin regime has also been reported from previous X-ray follow-up of red QSOs at similar redshift and luminosities (Wilkes et al. 2002; Urrutia et al. 2005; Brusa et al. 2005). At higher redshift and higher luminosity, the population of extremely red QSO instead shows higher column densities (NH ~ 1023 cm−2) on average, suggesting that these objects are partially hidden by their own equatorial outflows with a large opening angle (Goulding et al. 2018).
Sources accreting close to the Eddington limit with significant X-ray obscuration are expected to be caught in the feedback phase of merger-based galaxy-AGN co-evolutionary models (Fabian et al. 2008; Kakkad et al. 2016; Lansbury et al. 2020). This has been further confirmed by an unambiguous signature of an ionised wind in the [OIII] emission line profile (see Sect. 3.1), which remained unnoticed in all previous works. The derived outflow properties are in line with results from samples of z ~ 2 unobscured AGN (e.g. Kakkad et al. 2020). The relatively shorter distance with respect to its z > 1 analogue makes eFEDS J091157.4+014327 a perfect target to further advance in the spatially resolved studies of ionised winds in obscured QSOs and their interaction with the ambient medium through dedicated MUSE and/or JWST observations.
The direct comparison of the AGN bolometric luminosity obtained from the SED fitting and the hard X-ray luminosity measured by eROSITA implies a hard X-ray bolometric correction kbol,HX ~ 12 for our source. This value is a factor of ~2 lower than is expected at similar luminosities from the correlation of the bolometric luminosity and the hard X-ray bolometric correction as reported in Duras et al. (2020; see also Lusso et al. 2012). Figure 5 shows the position of XID439 in the kbol,HX vs. Lbol, AGN plane, compared with the Duras et al. (2020) relation. The error bar comprises our uncertainties in the estimate of the bolometric luminosities from the SED fitting (see the appendix) and the uncertainties on the X-ray luminosity. We also report the values derived for a small sample of other X-ray obscured radioquiet QSOs at z ~ 1–4 in which kiloparsec-scale ionised outflows have been revealed and for which the bolometric luminosity has been derived from an accurate SED fitting (see references in the figure). Interestingly, for this small sample, kbol.HX appears lower than the average value at a fixed Lbol,AGN: in particular, we note that 12 out of 29 sources have kbolHX lower than the -1σ scatter of the correlation, to be compared to only two sources with kbolHX higher than the +1σ scatter. A higher contribution of LX to Lbol may in principle be ascribed to an inner ADAF and an outer truncated accretion disc as observed for local low-luminosity AGN (see e.g. Qiao et al. 2013). However, this may not be the case for our sources with kiloparsec-scale ionised outflows, all with bolometric luminosities higher than 1045 ergs-1. Giustini & Proga (2019) proposed that the diversity of the accretion and ejection flows in AGN can be explained, in addition to the variation in Eddington ratio and black hole mass, by the inclusion of accretion disc winds. The ionised winds observed at kiloparsec scales are expected to be a subsequent phase of the evolution of accretion disc winds. Although the statistics is still limited, the fact that the sources are caught in a peculiar phase of their evolution might cause the observed atypical balance of disc and corona emissions with respect to the overall population of type 1 and type 2 QSO (see also Brusa et al. 2016; Perna 2016). Larger samples of quasars with ionised outflows and well-constrained bolometric correction are critical for testing this scenario.
Finally, the combined X-ray, radio, and red colour selection represents the best approach to select luminous AGN with all the expected properties of objects caught in the short-lived feedback phase. The observed radio emission can signal the presence of relativistic, unresolved jets in young radio sources that may be responsible for most of the ejection of material (see e.g. Jarvis et al. 2019). The availability of a hard X-ray selected AGN sample over the entire sky with associated spectroscopic coverage is crucial for investigating whether ionised outflowing gas also exists in X-ray sources without prominent radio emission. The results presented in this work therefore constitute a pathfinder for eROSITA discoveries in the years to come over the full sky. By scaling the eFEDS area to the total extragalactic sky (a factor of ~250 in area), we expect a total number of ~750 outflowing QSOs candidate in the eROSITA hard-band catalogue. Half of them will lie in the German part of the sky, where spectroscopic follow-up by SDSS-V (Kollmeier et al. 2017) and 4MOST (de Jong et al. 2019) will be available and will provide immediate spectroscopic identification for all sources brighter than r = 22.5. Similarly, sources detected in the eROSITA all-sky hard X-ray survey that are matched with adequate spectroscopic information will enable the discovery of larger samples of (obscured) QSOs with simultaneous low kbol and clear outflow signatures. These are needed to constrain feedback models.
Target properties.
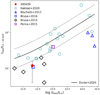 |
Fig. 5 Hard X-ray bolometric correction as a function of the bolometric luminosity. XID439 is indicated by the red star. Other X-ray QSOs at z ~ 1–3.5 for which ionised gas outflows on the kiloparsec scale have been detected and for which a solid estimate of the bolometric luminosity from SED fitting is available are also plotted as labelled. In most cases, the X-ray spectral analysis and SED fitting were performed on data of similar quality (in terms of counting statistics, depth of the images, and photometric errors) of the analysis of XID439, and we expect that the associated error bar would be similar. The solid and dotted lines are the analytic expressions for the hard X-ray bolometric correction and its scatter derived in Duras et al. (2020). |
Acknowledgements
This work is based on data from eROSITA, the soft X-ray instrument aboard SRG, a joint Russian-German science mission supported by the Russian Space Agency (Roskosmos), in the interests of the Russian Academy of Sciences represented by its Space Research Institute (IKI), and the Deutsches Zentrum für Luft- und Raumfahrt (DLR). The SRG spacecraft was built by Lavochkin Association (NPOL) and its subcontractors, and is operated by NPOL with support from the Max-Planck Institute for Extraterrestrial Physics (MPE). The development and construction of the eROSITA X-ray instrument was led by MPE, with contributions from the Dr. Karl Remeis Observatory Bamberg and ECAP (FAU Erlangen-Nuernberg), the University of Hamburg Observatory, the Leibniz Institute for Astrophysics Potsdam (AIP), and the Institute for Astronomy and Astrophysics of the University of Tübingen, with the support of DLR and the Max Planck Society. The Argelander Institute for Astronomy of the University of Bonn and the Ludwig Maximilians Universität Munich also participated in the science preparation for eROSITA. The eROSITA data shown here were processed using the eSASS/NRTA software system developed by the German eROSITA consortium. The Hyper Suprime-Cam (HSC) collaboration includes the astronomical communities of Japan and Taiwan, and Princeton University. The HSC instrumentation and software were developed by the National Astronomical Observatory of Japan (NAOJ), the Kavli Institute for the Physics and Mathematics of the Universe (Kavli IPMU), the University of Tokyo, the High Energy Accelerator Research Organization (KEK), the Academia Sinica Institute for Astronomy and Astrophysics in Taiwan (ASIAA), and Princeton University. Funding was contributed by the FIRST program from Japanese Cabinet Office, the Ministry of Education, Culture, Sports, Science and Technology (MEXT), the Japan Society for the Promotion of Science (JSPS), Japan Science and Technology Agency (JST), the Toray Science Foundation, NAOJ, Kavli IPMU, KEK, ASIAA, and Princeton University. Funding for the Sloan Digital Sky Survey (SDSS) has been provided by the Alfred P. Sloan Foundation, the Participating Institutions, the National Aeronautics and Space Administration, the National Science Foundation, the US Department of Energy, the Japanese Monbukagakusho, and the Max Planck Society. The SDSS Web site is http://www.sdss.org/. The SDSS is managed by the Astrophysical Research Consortium (ARC) for the Participating Institutions. The Participating Institutions are The University of Chicago, Fermilab, the Institute for Advanced Study, the Japan Participation Group, The Johns Hopkins University, Los Alamos National Laboratory, the Max-Planck-Institute for Astronomy (MPIA), the Max-Planck-Institute for Astrophysics (MPA), New Mexico State University, University of Pittsburgh, Princeton University, the United States Naval Observatory, and the University of Washington. MB acknowledges support from PRINMIUR2017PH3WAT (‘Black hole winds and the baryon life cycle of galaxies’). MP is supported by the Programa Atracción de Talento de la Comunidad de Madrid via grant 2018-T2/TIC-11715, and the Spanish Ministerio de Economía y Competitividad through the grant ESP2017-83197-P, and PID2019-106280GB-I00. BM is supported by the European Innovative Training Network (ITN) “BiD4BEST” funded by the Marie Sklodowska-Curie Actions in Horizon 2020 (GA 860744). JW acknowledges support by the Deutsche Forschungsge-meinschaft (DFG, German Research Foundation) under Germany’s Excellence Strategy - EXC-2094-390783311.
Appendix A Spectral energy distribution
The parameter ranges used in the SED fitting are summarised in Table A.1, in which we modelled the SED as follows. We assumed a delayed star formation history (SFH). For dust attenuation, we used the starburst attenuation curve provided by Calzetti et al. (2000). We modelled the photometry with a single stellar population (SSP) template from the Bruzual & Charlot (2003) library, assuming the initial mass function (IMF) of Chabrier (2003), and the standard nebular emission model included in X-CIGALE (see Inoue 2011). AGN emission was modelled using a clumpy two-phase torus model (SKIRTOR: Stalevski et al. 2016). We used the dust emission model provided by Draine et al. (2014). X-ray emission was modelled with fixed power-law photon indices of AGN, low-mass X-ray binaries (LMXBs), and high-mass X-ray binaries (HMXBs). A full explanation of the photometry used for the SED fitting and SED modelling for WISE-detected X-ray sources including XID439 is given by Toba et al. (2021, 2022).
In Fig. A.1, we present the SED fitting to a total of 19 photometric points and upper limits, from the X-ray to far-infrared available for XID439. From this best-fit solution, we adopted the values of Lboll,AGN, M⋆, and SFR.
We further checked for internal degeneracies in the SED fitting components by relaxing some of the assumed input parameters (e.g. the inclination disc angle Θ, the maximum allowed range for the X-ray photon index). We acknowledge that we can reproduce the observed SED with several combination of the best-fit parameters, with comparable statistical significance. However, in all the best-fit solutions we recover values for the stellar mass (3–12 x 1011 M⊙) and AGN bolometric luminosities (3–9 × 1045 erg s−1) that bracket our best-fit values in the reference set-up. For the SFR we retrieved a full range of values of 0.2–70 M_⊙ yr−1, with a median value of 2 M_⊙ yr−1. As already noted in Sect. 2.2, a solid estimate of the SFR is basically limited by the non-detection in the Herschel bands. In any case, there seems to be no significant evidence for a recent star- burst in any setup configuration. The fact that a recent starburst can be excluded is a further indication that we observe the source in the feedback phase (which is expected to follow the starburst phase).
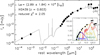 |
Fig. A.1 Best-fit SED from X-ray to FIR of eFEDS J091157.4+014327 obtained using X-CIGALE. The black points are all the photometric data, and the solid grey line represents the best-fit SED. The inset shows the SED at 0.1–500 μm where the contributions from the stellar, nebular, AGN, and SF components to the total SED are shown as labelled. |
Parameter ranges used in the SED fitting with X-CIGALE.
Appendix B Uncertainties in the estimate of the mass outflow rate
Uncertainties on  were obtained taking into account all the possible values in the ranges [3–30] kpc and [120–2000] cm−3 for Rout and ne, according to measured quantities at high-z (e.g. Kakkad et al. 2020 and Cicone et al. 2015, for the outflow extension; Brusa et al. 2015 and Förster Schreiber et al. (2019) for the electron density). For the outflow velocity, we considered the range [100–1650] km s−1, where the minimum value represents the velocity shift of the outflow component with respect to the systemic component, while the maximum value is the line width of the outflow component in Fig. 4b.
Appendix C X-ray stacking of type 2 QSOs
We stacked the 37 SDSS type 2 quasar sources (z = 0.4–0.65) that are undetected by eROSITA in the eFEDS X-ray footprint in the following way. First, in order to properly characterise the background, we masked previously detected sources in the X- ray images, assuming a 30′′ radius for point-like sources and the measured spatial extent for the extended sources in the Brunner et al. 2022 catalogue. The procedure was repeated in four bands: full (0.2–10keV), soft (0.2–10.6 keV), intermediate (0.6–2.3 keV), and hard (2.3–5.0 keV). We then stacked the signal in all four bands by taking the mean of the inverse exposure-weighted 2′ × 2′ cutouts centred on each of the 37 type 2 QSO positions, basically creating count-rate stacked images. To not overly weight sources at the edges of the field, we required a minimum exposure time of 180 s, which cut the number of stacked sources to 35. We tried to detect the source by PSF- matching the centre to the background, failing to exceed an S/N of 1.5 in all four bands (the intermediate band had a count rate of 2.24 ± 1.68 × 10⁻³ cts s−1, with an S/N of 1.33 above the background, which we deem insufficient for a significant measurement). Lastly, we determined the 3σ limiting fluxes above the background to be detected using appropriate energy conversion factors calculated using an absorbed power-law model with column density log(NH/cm−2) = 20 and photon index Γ= 1.7. We can therefore place upper limits of 1.58 x 10⁻¹⁵ erg cm-2 s-1 and 1.12 × 10⁻¹⁴ erg cm−2 s−1 on the 0.6–2.3 keV and 2.3–5 keV bands, respectively.
References
- Aihara, H., Armstrong, R., Bickerton, S., et al. 2018a, PASJ, 70, S8 [NASA ADS] [Google Scholar]
- Aihara, H., Arimoto, N., Armstrong, R., et al. 2018b, PASJ, 70, S4 [NASA ADS] [Google Scholar]
- Aihara, H., AlSayyad, Y., Ando, M., et al. 2019, PASJ, 71, 114 [Google Scholar]
- Alexander, D. M., Smail, I., Bauer, F. E., et al. 2005, Nature, 434, 738 [NASA ADS] [CrossRef] [Google Scholar]
- Arnaud, K. A. 1996, Astron. Data Anal. Softw. Syst. V, 101, 17 [NASA ADS] [Google Scholar]
- Assef, R. J., Eisenhardt, P. R. M., Stern, D., et al. 2015, ApJ, 804, 27 [Google Scholar]
- Bae, H.-J., & Woo, J.-H. 2014, ApJ, 795, 30 [NASA ADS] [CrossRef] [Google Scholar]
- Becker, R. H., White, R. L., & Helfand, D. J. 1995, ApJ, 450, 559 [Google Scholar]
- Bischetti, M., Piconcelli, E., Vietri, G., et al. 2017, A&A, 598, A122 [NASA ADS] [CrossRef] [EDP Sciences] [Google Scholar]
- Blecha, L., Snyder, G. F., Satyapal, S., et al. 2018, MNRAS, 478, 3056 [CrossRef] [Google Scholar]
- Boquien, M., Burgarella, D., Roehlly, Y., et al. 2019, A&A, 622, A103 [NASA ADS] [CrossRef] [EDP Sciences] [Google Scholar]
- Brightman, M., Silverman, J. D., Mainieri, V., et al. 2013, MNRAS, 433, 2485 [Google Scholar]
- Brunner, H., Liu, T., Lamer, G., et al. 2022, A&A, 661, A1 (eROSITA EDR SI) [NASA ADS] [CrossRef] [EDP Sciences] [Google Scholar]
- Brusa, M., Comastri, A., Daddi, E., et al. 2005, A&A, 432, 69 [NASA ADS] [CrossRef] [EDP Sciences] [Google Scholar]
- Brusa, M., Fiore, F., Santini, P., et al. 2009, A&A, 507, 1277 [NASA ADS] [CrossRef] [EDP Sciences] [Google Scholar]
- Brusa, M., Civano, F., Comastri, A., et al. 2010, ApJ, 716, 348 [NASA ADS] [CrossRef] [Google Scholar]
- Brusa, M., Bongiorno, A., Cresci, G., et al. 2015, MNRAS, 446, 2394 [NASA ADS] [CrossRef] [Google Scholar]
- Brusa, M., Perna, M., Cresci, G., et al. 2016, A&A, 588, A58 [NASA ADS] [CrossRef] [EDP Sciences] [Google Scholar]
- Bruzual, G., & Charlot, S. 2003, MNRAS, 344, 1000 [NASA ADS] [CrossRef] [Google Scholar]
- Buchner, J. 2019, PASP, 131, 108005 [Google Scholar]
- Buchner, J. 2016, Stat. Comput., 26, 383 [Google Scholar]
- Buchner, J., Georgakakis, A., Nandra, K., et al. 2014, A&A, 564, A125 [NASA ADS] [CrossRef] [EDP Sciences] [Google Scholar]
- Calzetti, D., Armus, L., Bohlin, R. C., et al. 2000, ApJ, 533, 682 [NASA ADS] [CrossRef] [Google Scholar]
- Chabrier, G. 2003, PASP, 115, 763 [Google Scholar]
- Chen, C.-T. J., Hickox, R. C., Goulding, A. D., et al. 2017, ApJ, 837, 145 [Google Scholar]
- Cicone, C., Maiolino, R., Gallerani, S., et al. 2015, A&A, 574, A14 [NASA ADS] [CrossRef] [EDP Sciences] [Google Scholar]
- Cicone, C., Brusa, M., Ramos Almeida, C., et al. 2018, Nat. Astron., 2, 176 [Google Scholar]
- Cresci, G., Mainieri, V., Brusa, M., et al. 2015, ApJ, 799, 82 [Google Scholar]
- Daddi, E., Alexander, D. M., Dickinson, M., et al. 2007, ApJ, 670, 173 [NASA ADS] [CrossRef] [Google Scholar]
- de Jong, R. S., Agertz, O., Berbel, A. A., et al. 2019, The Messenger, 175, 3 [NASA ADS] [Google Scholar]
- Dey, A., Soifer, B. T., Desai, V., et al. 2008, ApJ, 677, 943 [NASA ADS] [CrossRef] [Google Scholar]
- Donley, J. L., Koekemoer, A. M., Brusa, M., et al. 2012, ApJ, 748, 142 [Google Scholar]
- Draine, B. T., Aniano, G., Krause, O., et al. 2014, ApJ, 780, 172 [Google Scholar]
- Duras, F., Bongiorno, A., Ricci, F., et al. 2020, A&A, 636, A73 [NASA ADS] [CrossRef] [EDP Sciences] [Google Scholar]
- Eckmiller, H. J., Hudson, D. S., & Reiprich, T. H. 2011, A&A, 535, A105 [NASA ADS] [CrossRef] [EDP Sciences] [Google Scholar]
- Fabian, A. C. 2012, ARA&A, 50, 455 [Google Scholar]
- Fabian, A. C., Vasudevan, R. V., & Gandhi, P. 2008, MNRAS, 385, L43 [NASA ADS] [CrossRef] [Google Scholar]
- Fanti, C., Fanti, R., Dallacasa, D., et al. 1995, A&A, 302, 317 [NASA ADS] [Google Scholar]
- Fiore, F., Puccetti, S., Brusa, M., et al. 2009, ApJ, 693, 447 [NASA ADS] [CrossRef] [Google Scholar]
- Fiore, F., Feruglio, C., Shankar, F., et al. 2017, A&A, 601, A143 [NASA ADS] [CrossRef] [EDP Sciences] [Google Scholar]
- Förster Schreiber, N. M., Übler, H., Davies, R. L., et al. 2019, ApJ, 875, 21 [Google Scholar]
- Georgakakis, A., Aird, J., Schulze, A., et al. 2017, MNRAS, 471, 1976 [NASA ADS] [CrossRef] [Google Scholar]
- Giustini, M., & Proga, D. 2019, A&A, 630, A94 [NASA ADS] [CrossRef] [EDP Sciences] [Google Scholar]
- Goulding, A. D., Zakamska, N. L., Alexandroff, R. M., et al. 2018, ApJ, 856, 4 [Google Scholar]
- Harrison, C. M., Alexander, D. M., Mullaney, J. R., et al. 2014, MNRAS, 441, 3306 [Google Scholar]
- Hasinger, G., Cappelluti, N., Brunner, H., et al. 2007, ApJS, 172, 29 [NASA ADS] [CrossRef] [Google Scholar]
- Heckman, T. M., Ptak, A., Hornschemeier, A., et al. 2005, ApJ, 634, 161 [NASA ADS] [CrossRef] [Google Scholar]
- Hopkins, P. F., Hernquist, L., Cox, T. J., et al. 2008, ApJS, 175, 356 [NASA ADS] [CrossRef] [Google Scholar]
- Husemann, B., Scharwächter, J., Bennert, V. N., et al. 2016, A&A, 594, A44 [NASA ADS] [CrossRef] [EDP Sciences] [Google Scholar]
- Inoue, A. K. 2011, MNRAS, 415, 2920 [NASA ADS] [CrossRef] [Google Scholar]
- Jarvis, M. E., Harrison, C. M., Thomson, A. P., et al. 2019, MNRAS, 485, 2710 [Google Scholar]
- Kakkad, D., Mainieri, V., Padovani, P., et al. 2016, A&A, 592, A148 [NASA ADS] [CrossRef] [EDP Sciences] [Google Scholar]
- Kakkad, D., Mainieri, V., Vietri, G., et al. 2020, A&A, 642, A147 [NASA ADS] [CrossRef] [EDP Sciences] [Google Scholar]
- Kim, D., Im, M., Glikman, E., et al. 2015, ApJ, 812, 66 [NASA ADS] [CrossRef] [Google Scholar]
- King, A., & Pounds, K. 2015, ARA&A, 53, 115 [NASA ADS] [CrossRef] [Google Scholar]
- Kollmeier, J. A., Zasowski, G., Rix, H.-W., et al. 2017, ArXiv e-prints [arXiv:1711.03234] [Google Scholar]
- Kolodzig, A., Gilfanov, M., Sunyaev, R., et al. 2013, A&A, 558, A89 [NASA ADS] [CrossRef] [EDP Sciences] [Google Scholar]
- Kormendy, J., & Ho, L. C. 2013, ARA&A, 51, 511 [Google Scholar]
- Lacy, M., Storrie-Lombardi, L. J., Sajina, A., et al. 2004, ApJS, 154, 166 [Google Scholar]
- Lacy, M., Ridgway, S. E., Sajina, A., et al. 2015, ApJ, 802, 102 [NASA ADS] [CrossRef] [Google Scholar]
- LaMassa, S. M., Civano, F., Brusa, M., et al. 2016, ApJ, 818, 88 [NASA ADS] [CrossRef] [Google Scholar]
- Lansbury, G. B., Banerji, M., Fabian, A. C., et al. 2020, MNRAS, 495, 2652 [CrossRef] [Google Scholar]
- Lanzuisi, G., Piconcelli, E., Fiore, F., et al. 2009, A&A, 498, 67 [NASA ADS] [CrossRef] [EDP Sciences] [Google Scholar]
- Li, J., Silverman, J. D., Ding, X., et al. 2022, ApJ, 918, 22 [Google Scholar]
- Liu, T., Buchner, J., Nandra, K., et al. 2022, A&A, 661, A5 (eROSITA EDR SI) [NASA ADS] [CrossRef] [EDP Sciences] [Google Scholar]
- Lusso, E., Comastri, A., Simmons, B. D., et al. 2012, MNRAS, 425, 623 [Google Scholar]
- Lyke, B. W., Higley, A. N., McLane, J. N., et al. 2020, ApJS, 250, 8 [NASA ADS] [CrossRef] [Google Scholar]
- Marasco, A., Cresci, G., Nardini, E., et al. 2020, A&A, 644, A15 [EDP Sciences] [Google Scholar]
- Marconi, A., & Hunt, L. K. 2003, ApJ, 589, L21 [Google Scholar]
- Martínez-Sansigre, A., Rawlings, S., Lacy, M., et al. 2006, MNRAS, 370, 1479 [CrossRef] [Google Scholar]
- Mauch, T., Murphy, T., Buttery, H. J., et al. 2013, VizieR Online Data Catalog, VIII/81B [Google Scholar]
- Merloni, A., Predehl, P., Becker, W., et al. 2012, ArXiv e-prints [arXiv:1209.3114] [Google Scholar]
- Mingozzi, M., Cresci, G., Venturi, G., et al. 2019, A&A, 622, A146 [NASA ADS] [CrossRef] [EDP Sciences] [Google Scholar]
- Miyazaki, S., Komiyama, Y., Kawanomoto, S., et al. 2018, PASJ, 70, S1 [NASA ADS] [Google Scholar]
- Mullaney, J. R., Alexander, D. M., Fine, S., et al. 2013, MNRAS, 433, 622 [Google Scholar]
- Perna, M., Brusa, M., Cresci, G., et al. 2015, A&A, 583, A72 [NASA ADS] [CrossRef] [EDP Sciences] [Google Scholar]
- Perna, M., Starbursting to quenching: the role of X-ray emission in ActiveGalactic Nuclei feedback processes, http://amsdottorato.unibo.it/7767/1/perna_michele_tesi.pdf [Google Scholar]
- Perna, M., Lanzuisi, G., Brusa, M., et al. 2017, A&A, 603, A99 [NASA ADS] [CrossRef] [EDP Sciences] [Google Scholar]
- Piconcelli, E., Vignali, C., Bianchi, S., et al. 2015, A&A, 574, A9 [Google Scholar]
- Powell, M. C., Husemann, B., Tremblay, G. R., et al. 2018, A&A, 618, A27 [NASA ADS] [CrossRef] [EDP Sciences] [Google Scholar]
- Predehl, P., Andritschke, R., Arefiev, V., et al. 2021, A&A 647, A1 [EDP Sciences] [Google Scholar]
- Qiao, E., Liu, B. F., Panessa, F., et al. 2013, ApJ, 777, 102 [NASA ADS] [CrossRef] [Google Scholar]
- Ramos Almeida, C., Acosta-Pulido, J. A., Tadhunter, C. N., et al. 2019, MNRAS, 487, L18 [NASA ADS] [CrossRef] [Google Scholar]
- Reyes, R., Zakamska, N. L., Strauss, M. A., et al. 2008, AJ, 136, 2373 [Google Scholar]
- Ross, N. P., Hamann, F., Zakamska, N. L., et al. 2015, MNRAS, 453, 3932 [Google Scholar]
- Rupke, D. S. N., Gültekin, K., & Veilleux, S. 2017, ApJ, 850, 40 [NASA ADS] [CrossRef] [Google Scholar]
- Salvato, M., Wolf, J., Dwelly, T., et al. 2022, A&A, 661, A3 (eROSITA EDR SI) [NASA ADS] [CrossRef] [EDP Sciences] [Google Scholar]
- Schwarz, G. 1978, Ann. Stat., 6, 461 [Google Scholar]
- Schulze, A., & Wisotzki, L. 2014, MNRAS, 438, 3422 [CrossRef] [Google Scholar]
- Shemmer, O., Brandt, W. N., Netzer, H., et al. 2008, ApJ, 682, 81 [NASA ADS] [CrossRef] [Google Scholar]
- Silverman, J. D., Lamareille, F., Maier, C., et al. 2009, ApJ, 696, 396 [NASA ADS] [CrossRef] [Google Scholar]
- Simmonds, C., Buchner, J., Salvato, M., et al. 2018, A&A, 618, A66 [NASA ADS] [CrossRef] [EDP Sciences] [Google Scholar]
- Spergel, D. N., Verde, L., Peiris, H. V., et al. 2003, ApJS, 148, 175 [Google Scholar]
- Stalevski, M., Ricci, C., Ueda, Y., et al. 2016, MNRAS, 458, 2288 [Google Scholar]
- Stern, D., Eisenhardt, P., Gorjian, V., et al. 2005, ApJ, 631, 163 [Google Scholar]
- Stern, D., Lansbury, G. B., Assef, R. J., et al. 2014, ApJ, 794, 102 [Google Scholar]
- Tanaka, M. 2015, ApJ, 801, 20 [Google Scholar]
- Toba, Y., Ueda, Y., Matsuoka, K., et al. 2019a, MNRAS, 484, 196 [Google Scholar]
- Toba, Y., Yamashita, T., Nagao, T., et al. 2019b, ApJS, 243, 15 [Google Scholar]
- Toba, Y., Brusa, M., Liu, T., et al. 2021, A&A, 649, A11 [Google Scholar]
- Toba, Y., Liu, T., Urrutia, T., et al. 2022, A&A, 661, A15 (eROSITA EDR SI) [NASA ADS] [CrossRef] [EDP Sciences] [Google Scholar]
- Urrutia, T., Lacy, M., Gregg, M. D., et al. 2005, ApJ, 627, 75 [NASA ADS] [CrossRef] [Google Scholar]
- Urrutia, T., Becker, R. H., White, R. L., et al. 2009, ApJ, 698, 1095 [Google Scholar]
- Urrutia, T., Lacy, M., Spoon, H., et al. 2012, ApJ, 757, 125 [Google Scholar]
- Vanden Berk, D. E., Richards, G. T., Bauer, A., et al. 2001, AJ, 122, 549 [Google Scholar]
- Venturi, G., Nardini, E., Marconi, A., et al. 2018, A&A, 619, A74 [NASA ADS] [CrossRef] [EDP Sciences] [Google Scholar]
- Wilkes, B. J., Schmidt, G. D., Cutri, R. M., et al. 2002, ApJ, 564, L65 [Google Scholar]
- Wright, E. L., Eisenhardt, P. R. M., Mainzer, A. K., et al. 2010, AJ, 140, 1868 [Google Scholar]
- Yamashita, T., Nagao, T., Akiyama, M., et al. 2018, ApJ, 866, 140 [NASA ADS] [CrossRef] [Google Scholar]
- Yang, G., Boquien, M., Buat, V., et al. 2020, MNRAS, 491, 740 [Google Scholar]
- Yuan, S., Strauss, M. A., & Zakamska, N. L. 2016, MNRAS, 462, 1603 [NASA ADS] [CrossRef] [Google Scholar]
- Zakamska, N. L., Strauss, M. A., Krolik, J. H., et al. 2003, AJ, 126, 2125 [NASA ADS] [CrossRef] [Google Scholar]
- Zakamska, N. L., Hamann, F., Pâris, I., et al. 2016, MNRAS, 459, 3144 [NASA ADS] [CrossRef] [Google Scholar]
- Zubovas, K., & King, A. R. 2012, MNRAS, 426, 2751 [NASA ADS] [CrossRef] [Google Scholar]
We derived the 2–10keV flux from the 2.3–5keV flux tabulated in the eFEDS catalogue by applying a correction factor of 2.27 assuming Γ= 1.7.
This method with the same assumptions is widely used in the literature to determine the Eddington ratio for large samples of X-ray selected AGN, when SED fitting and/or optical/NIR spectroscopy sampling broad emission lines are not available (e.g. Brusa et al. 2009). With this method, we would obtain Lbol ~ 1.6 × 1046 erg s−1, MBH ~ 8.8 × 10⁸ M⊙, and Lbol/LEdd ~ 0.1 for XID439, which still significantly exceeds the average values.
XID439 is also in the extremely red quasar sample of 645 objects selected from the cross-correlation of SDSS, BOSS, and WISE catalogues on the basis of a red r-W4 >14 (Ross et al. 2015): of the two sources falling in the eFEDS area, XID439 alone is detected by eROSITA.
In this catalogue. an incorrect redshift was used for the SED fitting of XID439, and the derived parameters are superseded by this work.
All Tables
All Figures
|
Fig. 1 Diagnostic diagram used to isolate QSO candidates in the feedback phase: X-ray to optical flux ratio vs. r-Wl colours for all the 246 eFEDS sources detected in the hard band in the eFEDS sample. Red points mark sources in the selection locus for the windy QSOs at r-Wl > 4 and log X/O > 1 (upper right corner). Blue points mark all other sources. Sources with less reliable counterparts in the hard X-ray sample are marked with dotted lines. Source XID439 is marked by a large red star. |
| In the text | |
|
Fig. 2 eROSITA spectrum of XID439 (blue points). The source, background, and source + background models are superposed as labelled. Bottom panel: ratio of data to the best-fit model. |
| In the text | |
|
Fig. 3 Top panel: HSC colour image (band: grz) of the windy QSO XID439. The cutout size is ~25′′ on side. The dashed rectangle highlights the area in which the host galaxy-AGN decomposition was performed. Bottom panel: host galaxy-AGN decomposition on Subaru i-band data. The panels from left to right are a zoom in the central area of the top panel (dashed rectangle, ~10′′ in size) as follows: (1) observed HSC i-band image, (2) best-fit point source + galaxy model, (3) data minus the point source model (i.e., the pure-galaxy image), (4) data minus the galaxy model (i.e. the pure-AGN image); and (5) fitting residual divided by the variance map. In all panels, north is up and east is left. |
| In the text | |
|
Fig. 4 SDSS spectrum of XID439 (panel a) from ~5000 to ~ 10 000 Å. The templates of type 1 and type 2 AGN are superimposed as labelled, highlighting the significant reddening of XID439 and its likely type 2 nature. A close-in zoom of the Hβ+[OIII] lines complex is shown (panel b) with the two-Gaussian best-fit decomposition. |
| In the text | |
|
Fig. 5 Hard X-ray bolometric correction as a function of the bolometric luminosity. XID439 is indicated by the red star. Other X-ray QSOs at z ~ 1–3.5 for which ionised gas outflows on the kiloparsec scale have been detected and for which a solid estimate of the bolometric luminosity from SED fitting is available are also plotted as labelled. In most cases, the X-ray spectral analysis and SED fitting were performed on data of similar quality (in terms of counting statistics, depth of the images, and photometric errors) of the analysis of XID439, and we expect that the associated error bar would be similar. The solid and dotted lines are the analytic expressions for the hard X-ray bolometric correction and its scatter derived in Duras et al. (2020). |
| In the text | |
|
Fig. A.1 Best-fit SED from X-ray to FIR of eFEDS J091157.4+014327 obtained using X-CIGALE. The black points are all the photometric data, and the solid grey line represents the best-fit SED. The inset shows the SED at 0.1–500 μm where the contributions from the stellar, nebular, AGN, and SF components to the total SED are shown as labelled. |
| In the text | |
Current usage metrics show cumulative count of Article Views (full-text article views including HTML views, PDF and ePub downloads, according to the available data) and Abstracts Views on Vision4Press platform.
Data correspond to usage on the plateform after 2015. The current usage metrics is available 48-96 hours after online publication and is updated daily on week days.
Initial download of the metrics may take a while.