Fig. 10
Download original image
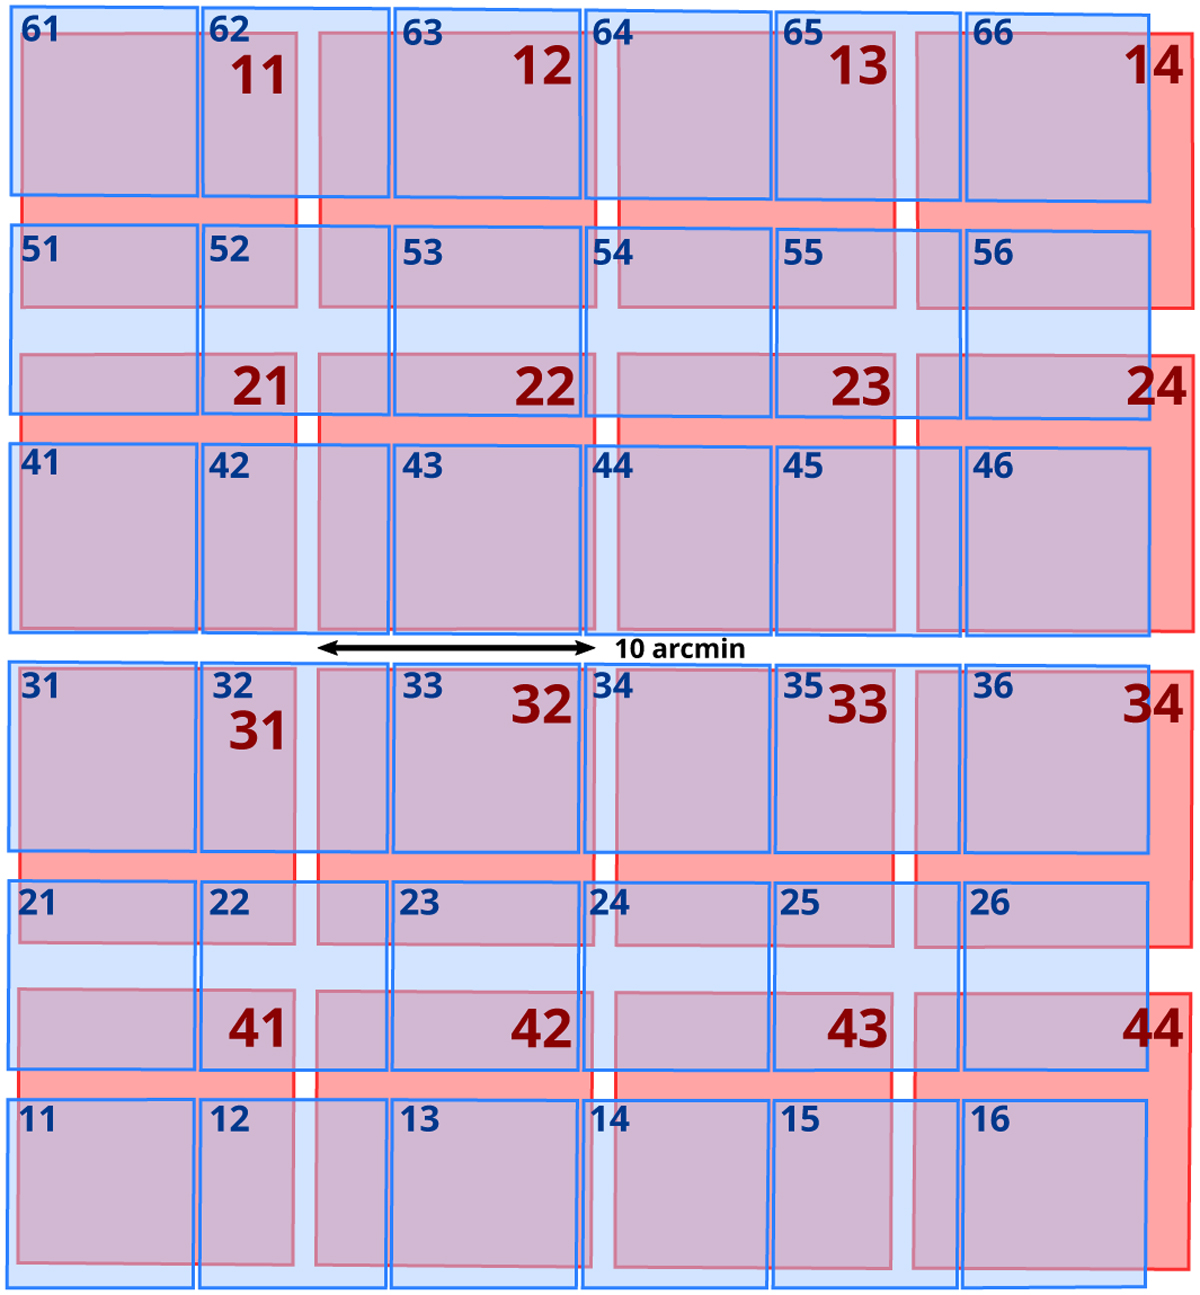
Common instrumental view to the sky of the VIS (blue) and NISP (red) instruments. The footprint was generated from two simultaneously taken VIS and NISP images, astrometrically calibrated and registered to a common pixel grid. Small blue numbers refer to VIS, large red numbers to NISP detector IDs. Interchip gaps are evident. The VIS detectors have an additional thin horizontal gap (not shown here) from the charge-injection lines used to monitor radiation damage through charge-transfer inefficiency. The respective spatial and angular offsets between both instruments are ![]() and
and ![]() .
.
Current usage metrics show cumulative count of Article Views (full-text article views including HTML views, PDF and ePub downloads, according to the available data) and Abstracts Views on Vision4Press platform.
Data correspond to usage on the plateform after 2015. The current usage metrics is available 48-96 hours after online publication and is updated daily on week days.
Initial download of the metrics may take a while.