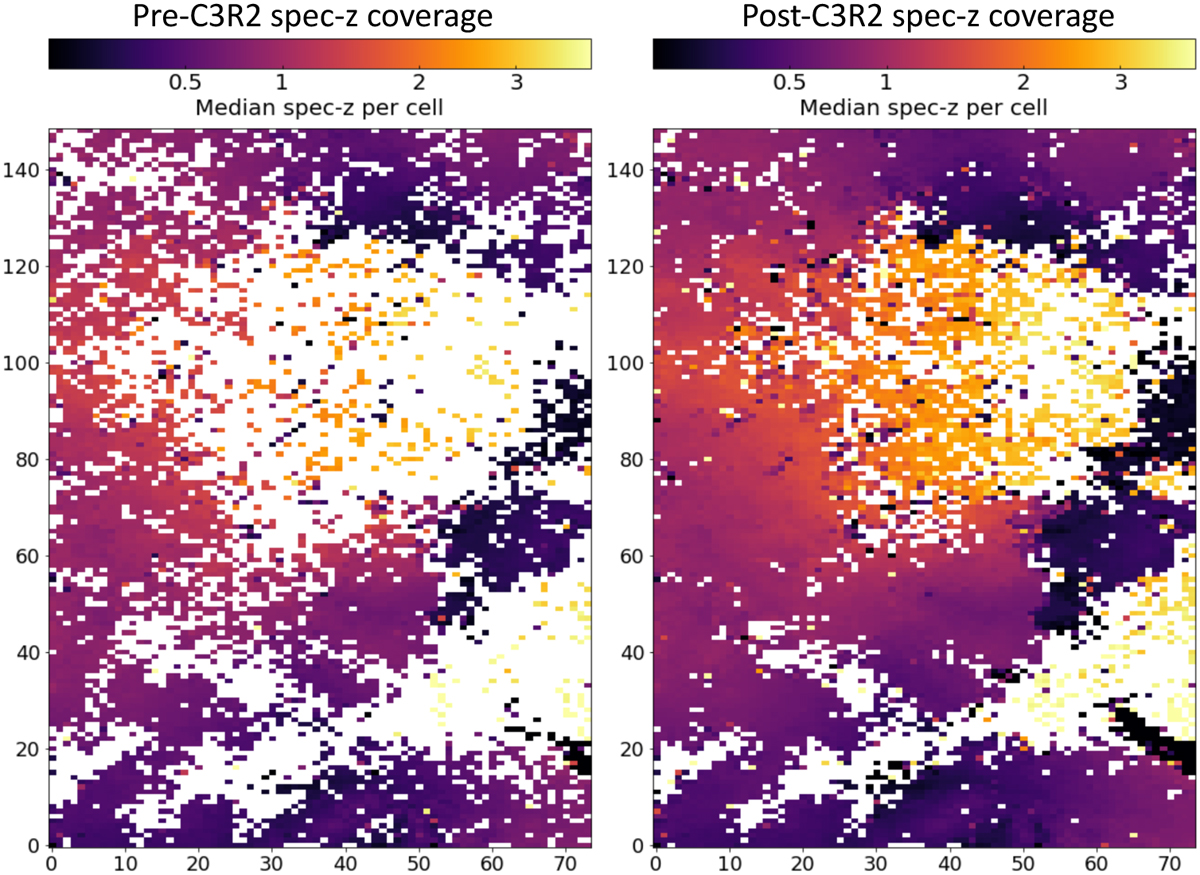
Fig. 19
Download original image
The galaxy multicolour-space to i = 25 AB mag, encoded in a 2 D map with a 150×75 binning using the self-organising map algorithm (Masters et al. 2015). On the left is the distribution of spectroscopic coverage of the map prior to the C3R2 effort. The white regions are those parts of galaxy-colour space lacking high-confidence spectroscopic redshifts for calibration. On the right is the current map, after incorporating the >5800 C3R2 faint galaxy spectra. The map coverage has increased from about 51% to > 90%, with many colour cells calibrated with multiple galaxies. Spectra to calibrate the remaining empty cells may be obtained as next-generation spectroscopic facilities come online, or they can be addressed with clustering redshift approaches (e.g. Newman 2008). We note that the remaining empty regions correspond to lower-density (less occupied) parts of the galaxy-colour space.
Current usage metrics show cumulative count of Article Views (full-text article views including HTML views, PDF and ePub downloads, according to the available data) and Abstracts Views on Vision4Press platform.
Data correspond to usage on the plateform after 2015. The current usage metrics is available 48-96 hours after online publication and is updated daily on week days.
Initial download of the metrics may take a while.