Fig. 29
Download original image
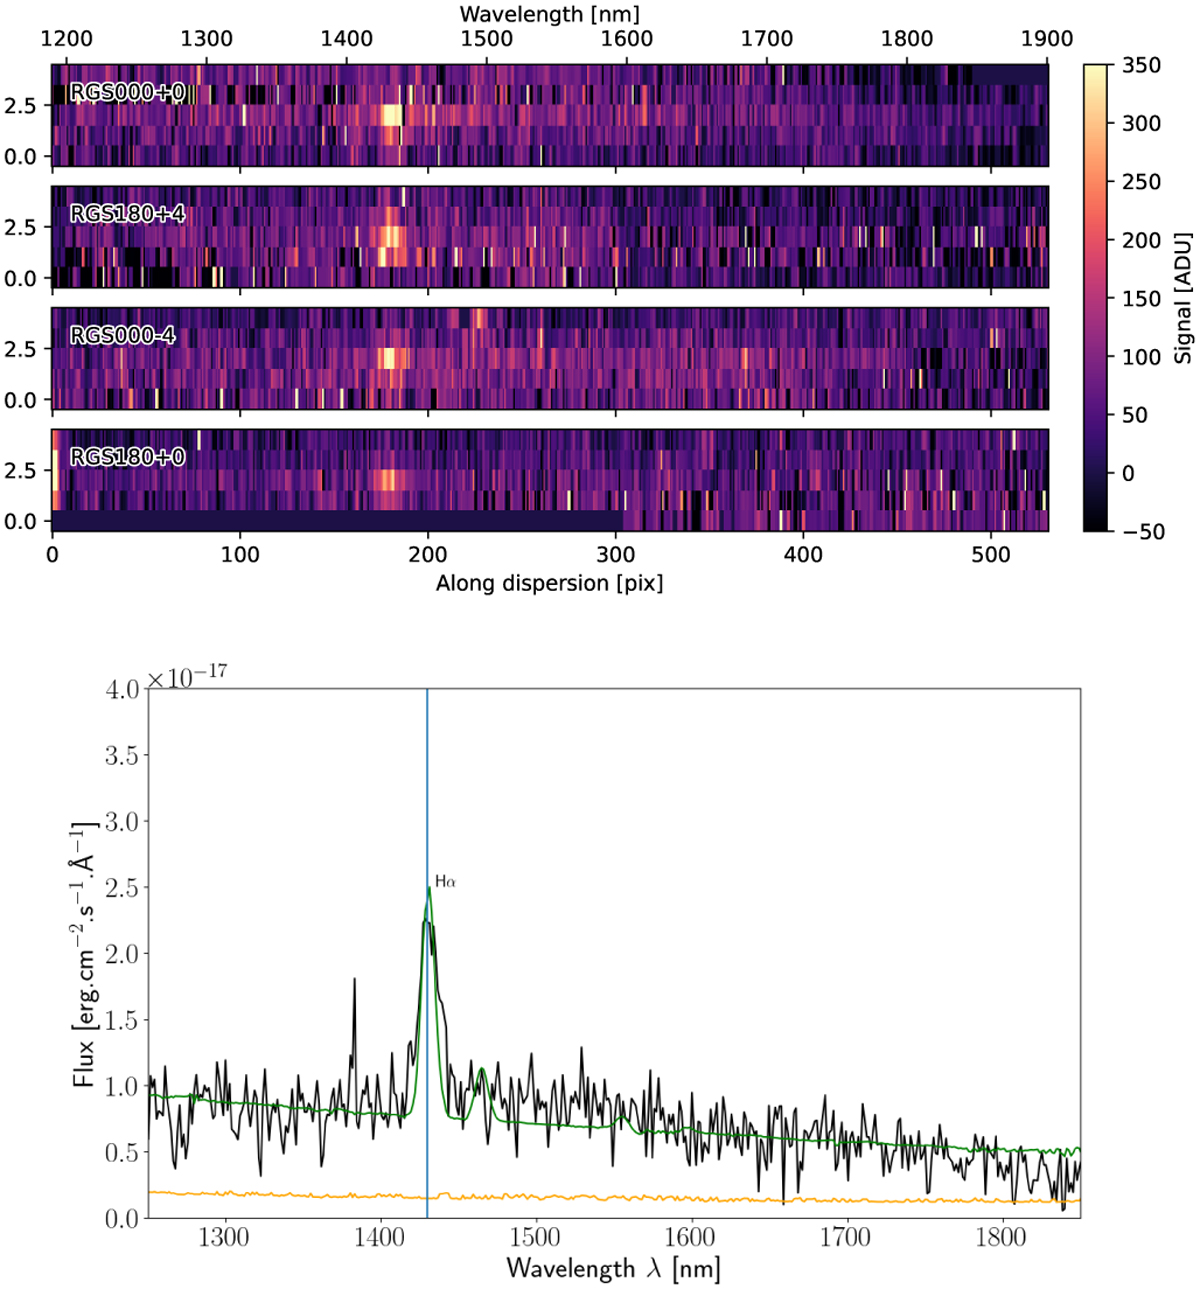
An example of NISP spectroscopic data for a galaxy in the COSMOS field with z = 1.1770 ± 0.0005 (Mainieri et al. 2007) The top figure shows the four spectrograms, with the Hα line clearly visible. The bottom plot shows the corresponding combined and flux-calibrated 1D spectrum (in black) and its associated statistical noise (in orange), while the green line shows the combined continuum and emission line model that fits the data best. The bright Hα line is detected with S/N = 14 yielding a redshift of z = 1.1783 ± 0.0005 (vertical blue line), which is in agreement with the previously published value. The flux of the line, fHα = 2 × 10⁻¹⁵ erg cm−2 s−1, is approximately ten times higher than the limiting flux for the EWS.
Current usage metrics show cumulative count of Article Views (full-text article views including HTML views, PDF and ePub downloads, according to the available data) and Abstracts Views on Vision4Press platform.
Data correspond to usage on the plateform after 2015. The current usage metrics is available 48-96 hours after online publication and is updated daily on week days.
Initial download of the metrics may take a while.