Fig. 31
Download original image
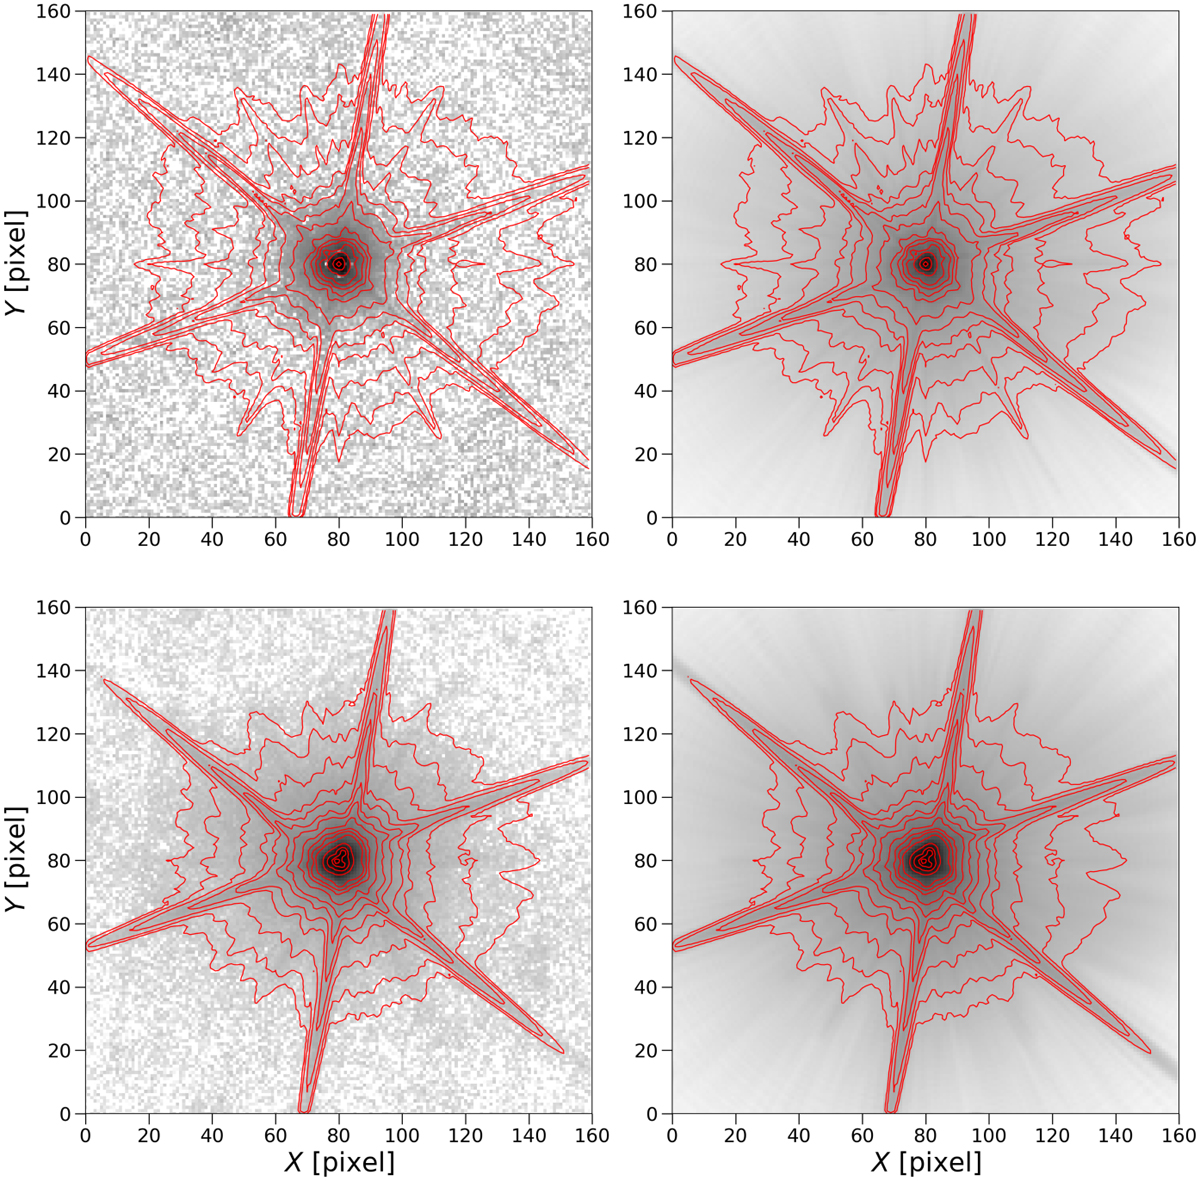
Comparison between the mean profile of stars and the VIS PSF model during the PV PDC test data. The left panels show stacked images of stars selected from CCD 4–5, while the right panels show the corresponding stacked model PSFs. The top panels show in-focus data and models, while the bottom panels show defocused data and models, obtained with M2 movement of −18 μm. All images are produced as the mean of fluxselected stars, applying 2 σ clipping on pixels to remove contaminating objects. Red contours are isophotes of the model PSF, superimposed on both the model and data images. The model is a pre-calibration one, fit to a small PDC test data set.
Current usage metrics show cumulative count of Article Views (full-text article views including HTML views, PDF and ePub downloads, according to the available data) and Abstracts Views on Vision4Press platform.
Data correspond to usage on the plateform after 2015. The current usage metrics is available 48-96 hours after online publication and is updated daily on week days.
Initial download of the metrics may take a while.