Open Access
Fig. 35
Download original image
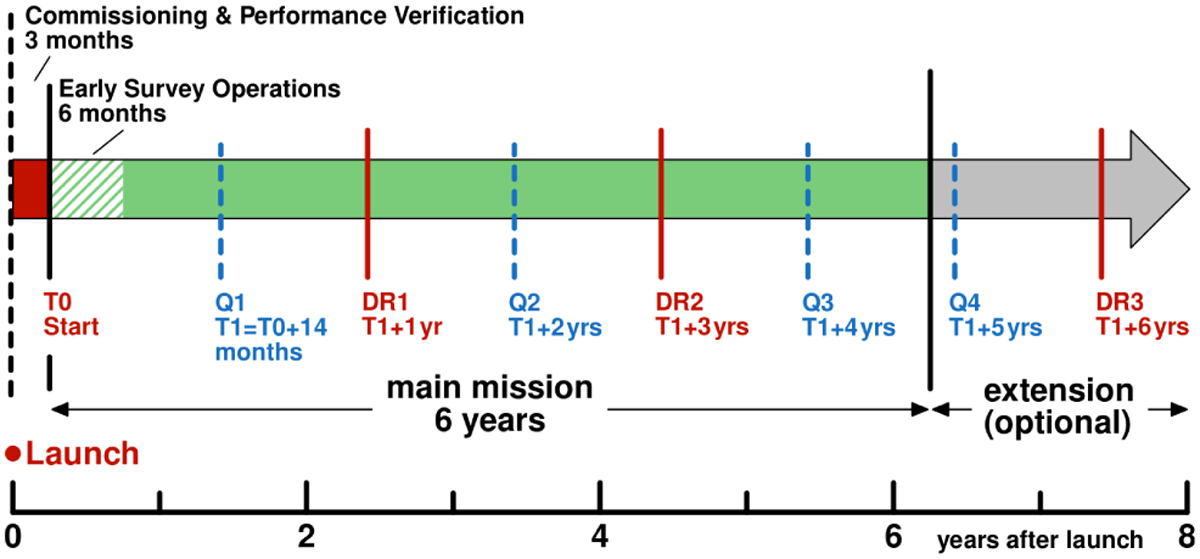
Tentative timeline for public data releases, indicating the three main DRs as well as four smaller quick releases (Q1–Q4). The moment of release is linked to the start of early survey operations, but unforeseen changes to the mission operation may lead to some changes to this nominal schedule.
Current usage metrics show cumulative count of Article Views (full-text article views including HTML views, PDF and ePub downloads, according to the available data) and Abstracts Views on Vision4Press platform.
Data correspond to usage on the plateform after 2015. The current usage metrics is available 48-96 hours after online publication and is updated daily on week days.
Initial download of the metrics may take a while.