Fig. 36
Download original image
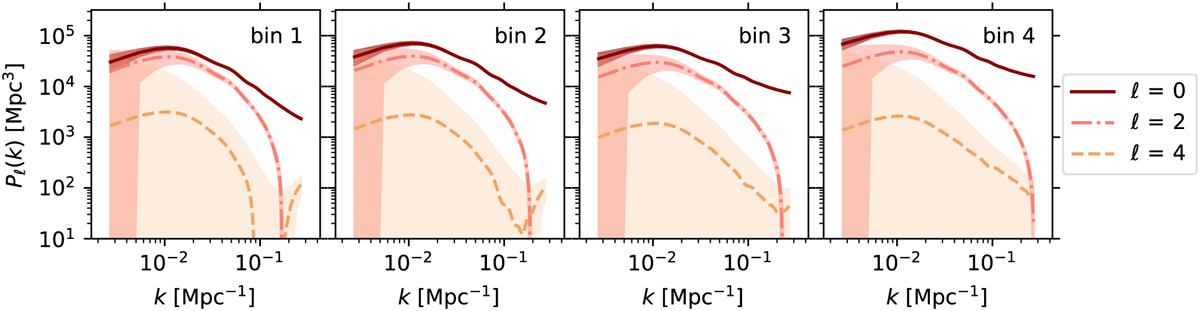
Legendre multipoles of the redshift-space power spectrum of galaxy clustering, Pℓ(k), as expected from the spectroscopic survey data within four redshift bins (respectively, 0.9 < z < 1.1, 1.1 < z < 1.3, 1.3 < z < 1.5 and 1.5 < z < 1.8, where the Pℓ(k) are evaluated at the mean of the redshift intervals). The plots show the monopole (ℓ = 0, solid line), quadrupole (ℓ = 2, dashed-dotted line), and hexadecapole (ℓ = 4, dashed line), together with their error corridors (shaded regions). The latter simply connect the 1-σ errors from the diagonal values of the analytical covariance matrix, computed for narrow bins of Δk = 0.0017 h Mpc−1. As a result of this fine binning, the shaded areas do not fully reflect the actual constraining power of the measurements.
Current usage metrics show cumulative count of Article Views (full-text article views including HTML views, PDF and ePub downloads, according to the available data) and Abstracts Views on Vision4Press platform.
Data correspond to usage on the plateform after 2015. The current usage metrics is available 48-96 hours after online publication and is updated daily on week days.
Initial download of the metrics may take a while.