Fig. 37
Download original image
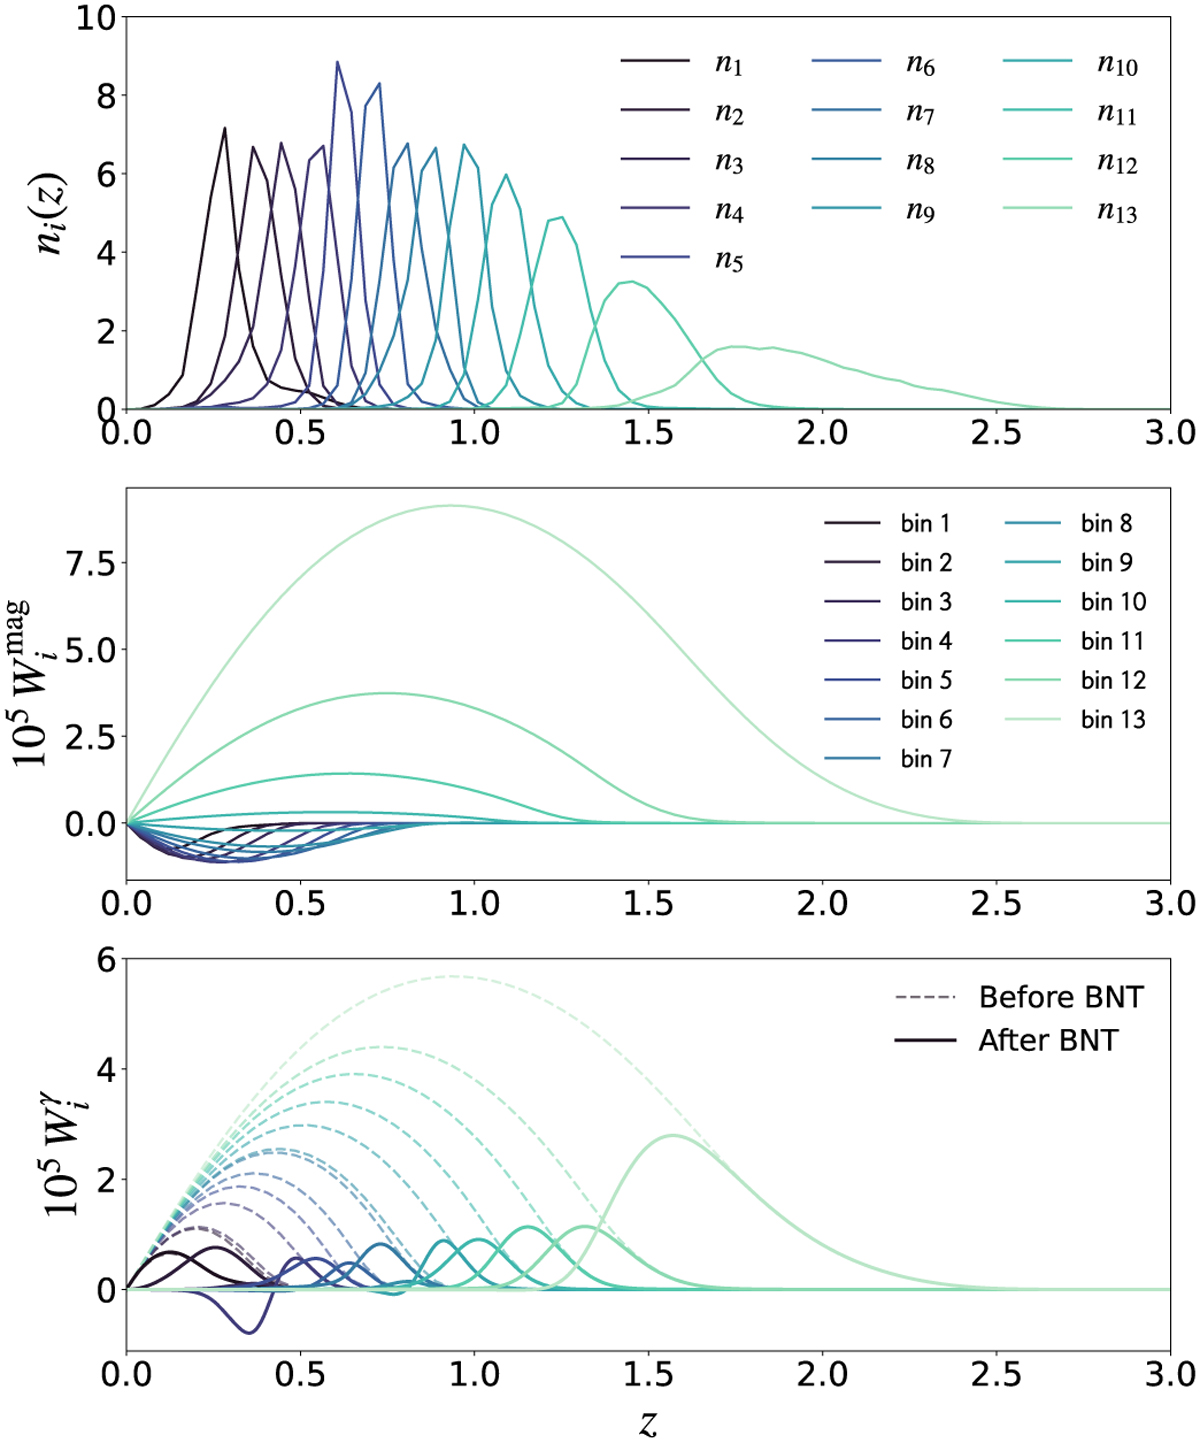
Top: normalised redshift distributions n(z), measured from the EFS, for the 13 equi-populated bins that were used for the 3×2pt analysis for the SPV. Middle: resulting photometric magnification kernels for the 13 redshift bins shown above. Bottom: corresponding shear kernels before (dashed) and after (solid lines) BNT transformation. The latter case gives a better grasp of the tomographic information that can be inferred from WL observations.
Current usage metrics show cumulative count of Article Views (full-text article views including HTML views, PDF and ePub downloads, according to the available data) and Abstracts Views on Vision4Press platform.
Data correspond to usage on the plateform after 2015. The current usage metrics is available 48-96 hours after online publication and is updated daily on week days.
Initial download of the metrics may take a while.