Fig. 45
Download original image
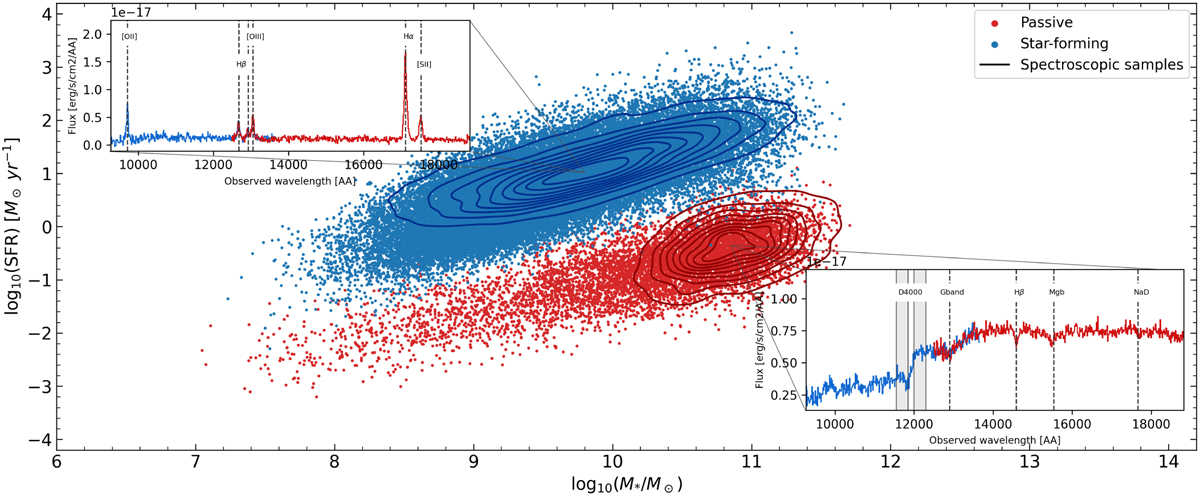
SFR-stellar mass diagram. The points represent the photometric sample, divided into star-forming (in blue) and passive galaxies (in red). Galaxy type was assigned as a function of mass and redshift from the stellar mass function (SMF) by Peng et al. (2010) and Ilbert et al. (2013). The coloured contours highlight the spectroscopic sample (for the EWS in the case of star-forming galaxies in blue, and for the EDS in the case of passive galaxies, in red). The two insets show two examples of star-forming and passive galaxies as observed in the EDS, comprising both the blue and the red grisms, simulated from the MAMBO mock catalogue (Girelli 2021) taking into account all instrumental and observational effects.
Current usage metrics show cumulative count of Article Views (full-text article views including HTML views, PDF and ePub downloads, according to the available data) and Abstracts Views on Vision4Press platform.
Data correspond to usage on the plateform after 2015. The current usage metrics is available 48-96 hours after online publication and is updated daily on week days.
Initial download of the metrics may take a while.