Fig. 46
Download original image
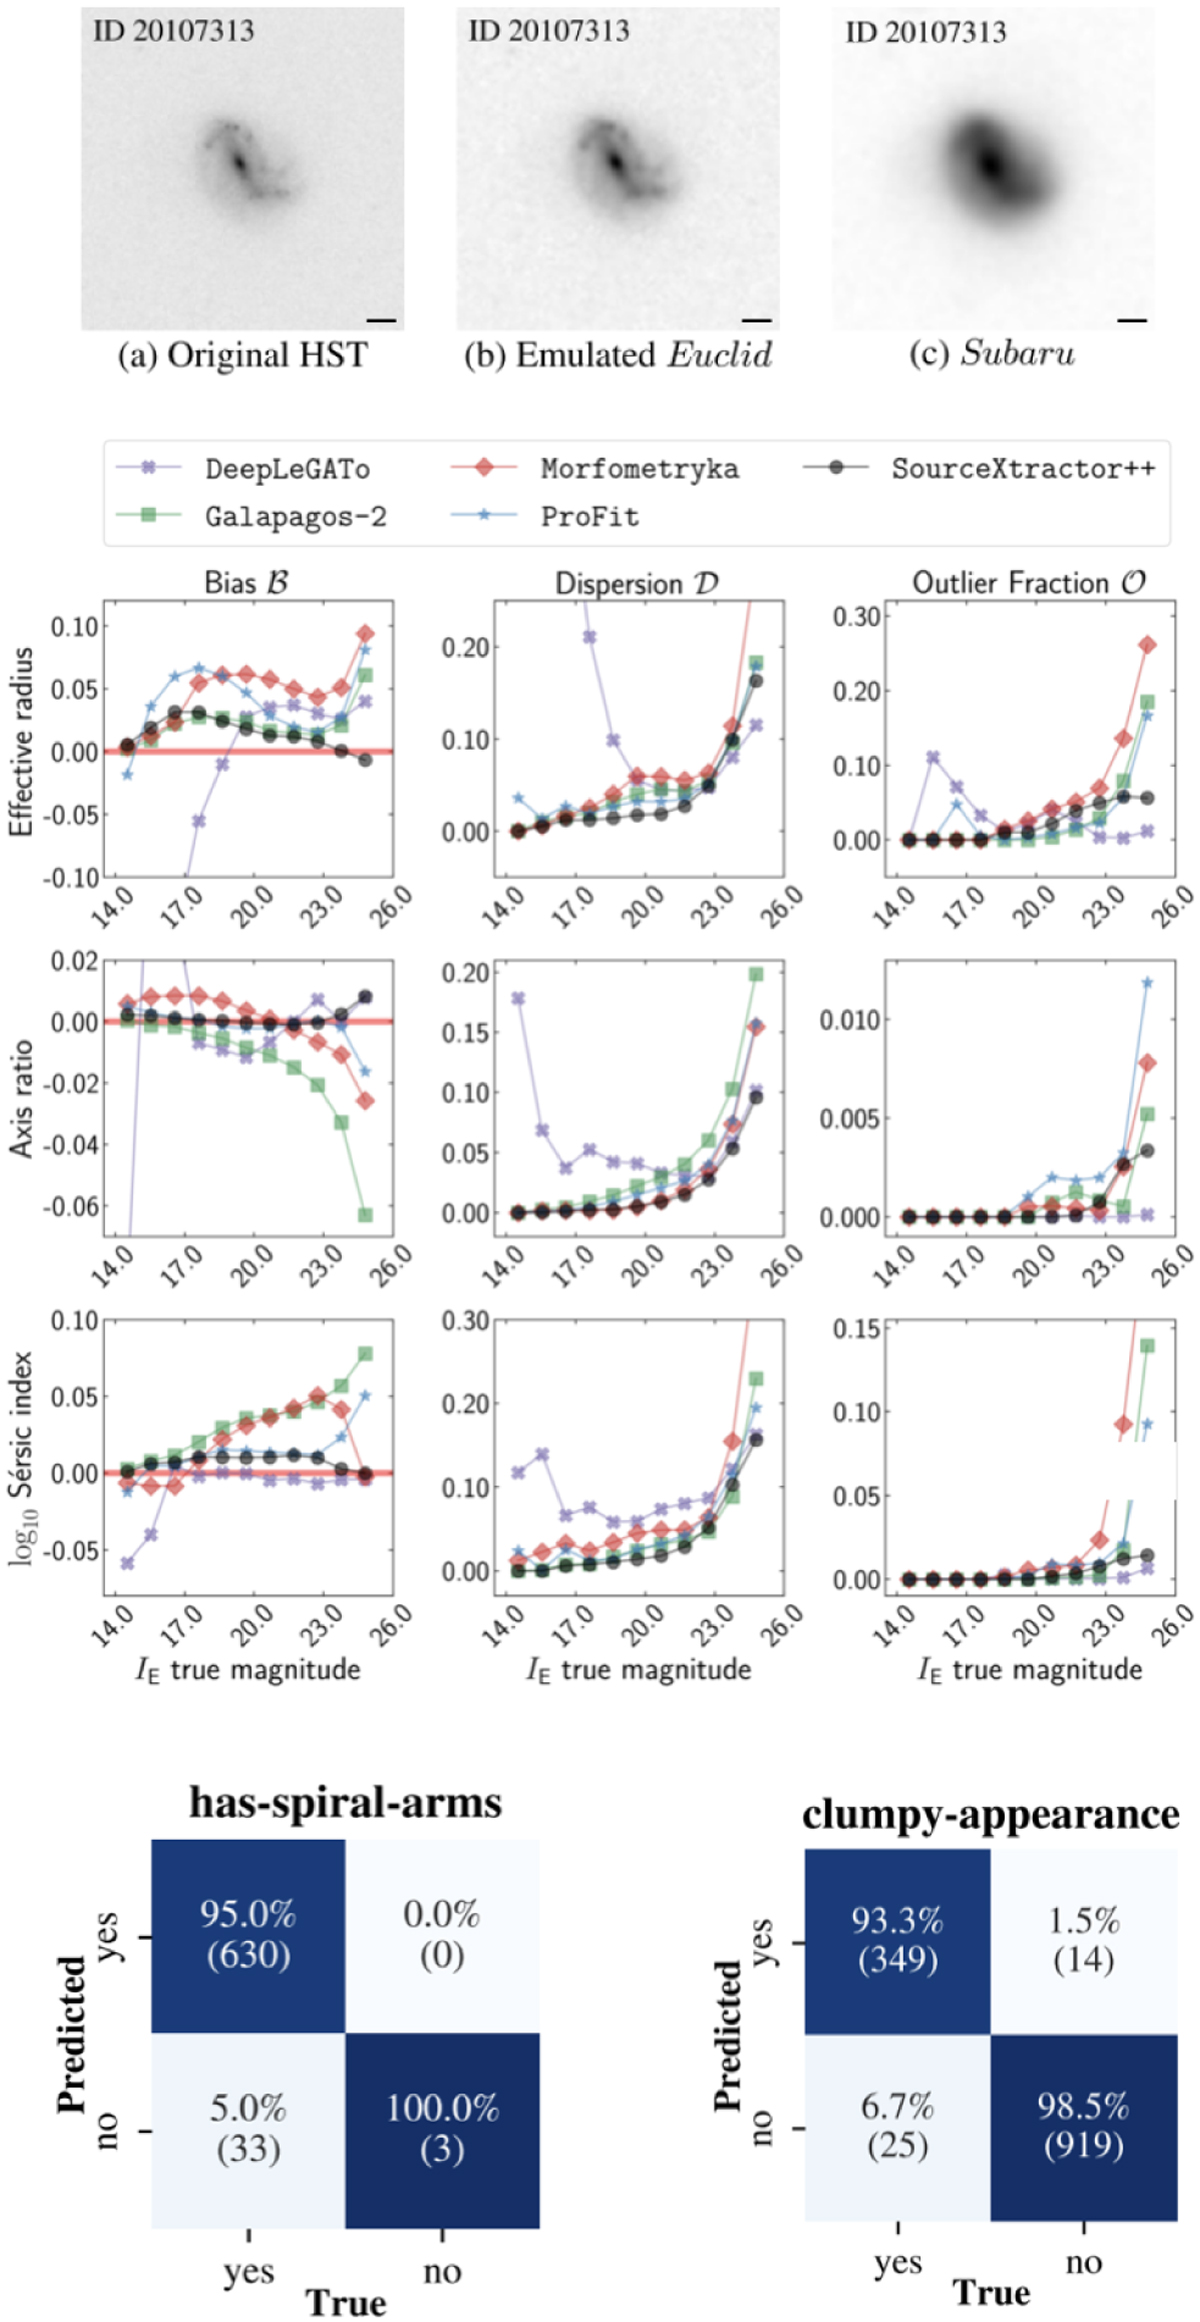
Illustration of Euclid’s capabilities to measure galaxy morphologies. Top panels: example of a simulated galaxy observed with VIS as compared to HST and Subaru/HSC. The horizontal black line indicates a 1″ length. Middle panels: comparison of the bias (left column), dispersion (middle column) and outlier fraction (right column) of the effective radii (top row), axis ratio (middle row) and Sérsic index (bottom row) for the best-fit Sérsic profiles obtained with different state-of-the art surface brightness fitting codes applied to simulated Euclid galaxies as a function of IE. Sérsic parameters can be obtained with errors smaller than ~10% down to a IE = 24. Bottom panels: accuracy of deep learning based morphological classifications on simulated Euclid observations of galaxies trained on human based labels. The confusion matrices show the accuracy for identifying spiral arms (left) and clumpy galaxies (right). Figure adapted from Euclid Collaboration: Aussel et al. (2024) and Euclid Collaboration: Bretonnière et al. (2023).
Current usage metrics show cumulative count of Article Views (full-text article views including HTML views, PDF and ePub downloads, according to the available data) and Abstracts Views on Vision4Press platform.
Data correspond to usage on the plateform after 2015. The current usage metrics is available 48-96 hours after online publication and is updated daily on week days.
Initial download of the metrics may take a while.