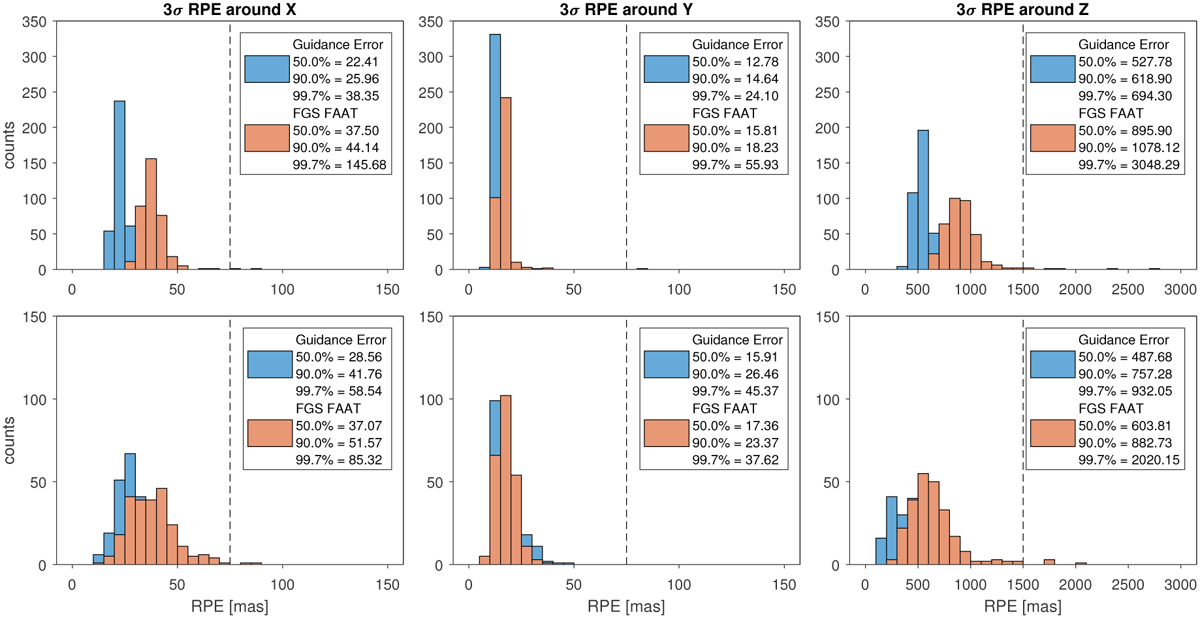
Fig. 8
Download original image
RPE performance in 360 nominal (top row) and 243 short (bottom row) VIS science exposures. The blue histograms are based on the AOCS controller-error vector, and the orange ones on the FGS-provided absolute quaternion. The dashed vertical lines show the 3 σ allocation by industry. Even though that requirement is not always met in practice, in particular about the z-axis, it does not mean that the PSF requirements are violated, because there are also margins on the optical PSF.
Current usage metrics show cumulative count of Article Views (full-text article views including HTML views, PDF and ePub downloads, according to the available data) and Abstracts Views on Vision4Press platform.
Data correspond to usage on the plateform after 2015. The current usage metrics is available 48-96 hours after online publication and is updated daily on week days.
Initial download of the metrics may take a while.