Fig. 1.
Download original image
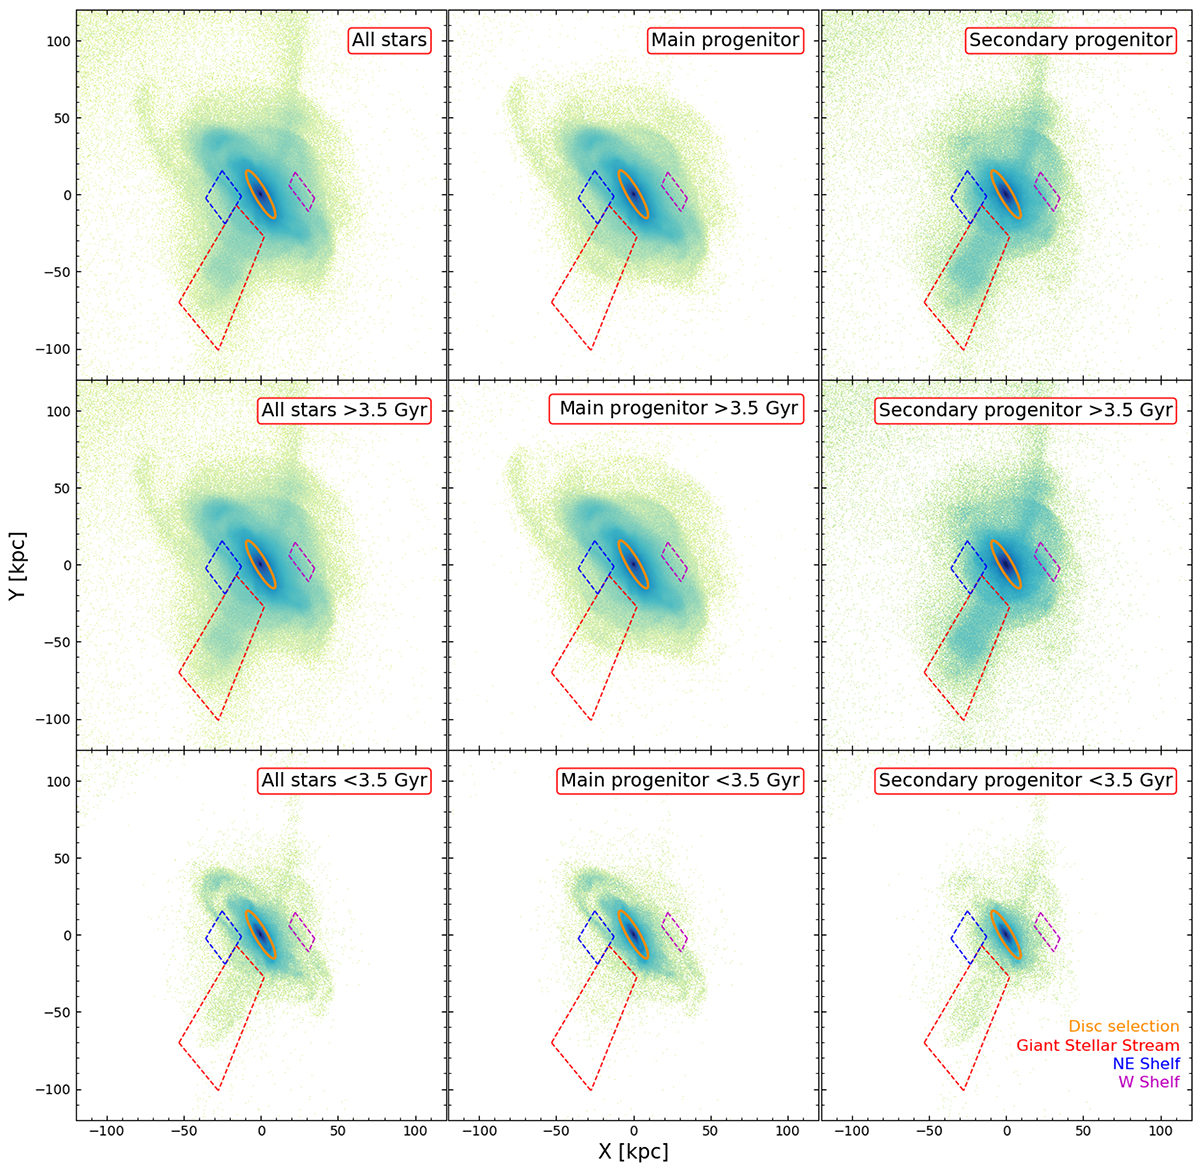
Spatial density map of the star particles at the end of the merger simulation. The galaxy is rotated and projected onto the sky plane according to the inclination and PA of M31. The selected areas for the M31 disc, the GSS and NE and W shelves are indicated with different colours. Upper row: All simulated stellar particles [left], main progenitor stellar particles [middle], and secondary progenitor stellar particles [right] are shown in independent panels. Middle row: Same differentiation, but only for stars older than 3.5 Gyr. Lower row: Same differentiation, but only for stars younger than 3.5 Gyr.
Current usage metrics show cumulative count of Article Views (full-text article views including HTML views, PDF and ePub downloads, according to the available data) and Abstracts Views on Vision4Press platform.
Data correspond to usage on the plateform after 2015. The current usage metrics is available 48-96 hours after online publication and is updated daily on week days.
Initial download of the metrics may take a while.