Fig. 12.
Download original image
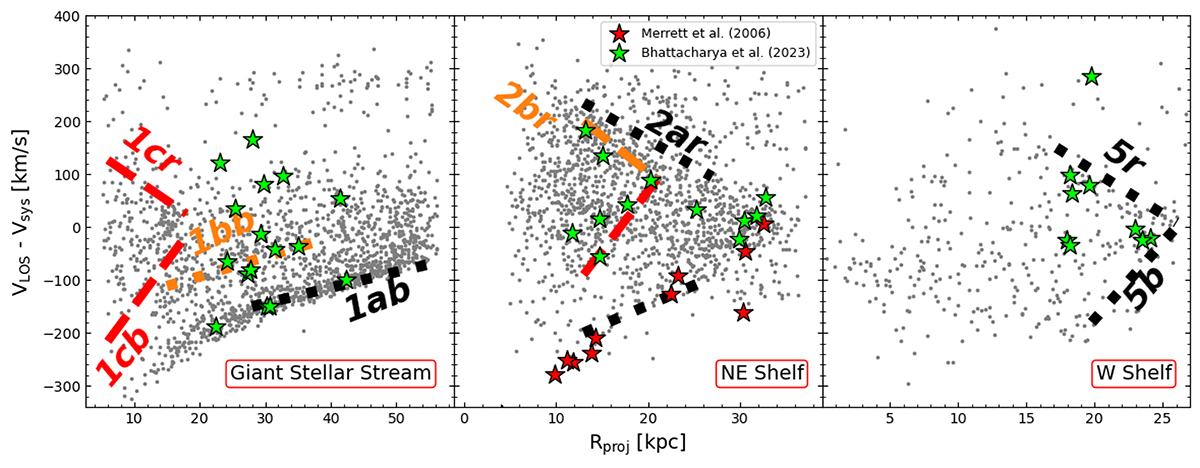
Position versus (VLOS − Vsys) velocity diagrams for three areas in the DESI survey. Each grey point is a star identified in the DESI survey. Each selected area encloses the substructure denoted by the bottom right label (GSS [left], NE shelf [middle], and W shelf [right]). Linear features (streams, wedges, and chevrons) from DESI are overplotted, with the labels used by D23. Orange dashed and black dotted lines designate particles from the main and the secondary progenitor, respectively, of analogous model features in Figs. 7, 9, 11. Whenever the same feature appears in the phase space of stars from both progenitors, it is sketched with red-dashed lines. The PNe data from Bhattacharya et al. (2023) are overplotted for each substructure as green stars. The PNe, classified as outliers by Merrett et al. (2003, 2006), are overplotted in the NE shelf region as red stars.
Current usage metrics show cumulative count of Article Views (full-text article views including HTML views, PDF and ePub downloads, according to the available data) and Abstracts Views on Vision4Press platform.
Data correspond to usage on the plateform after 2015. The current usage metrics is available 48-96 hours after online publication and is updated daily on week days.
Initial download of the metrics may take a while.