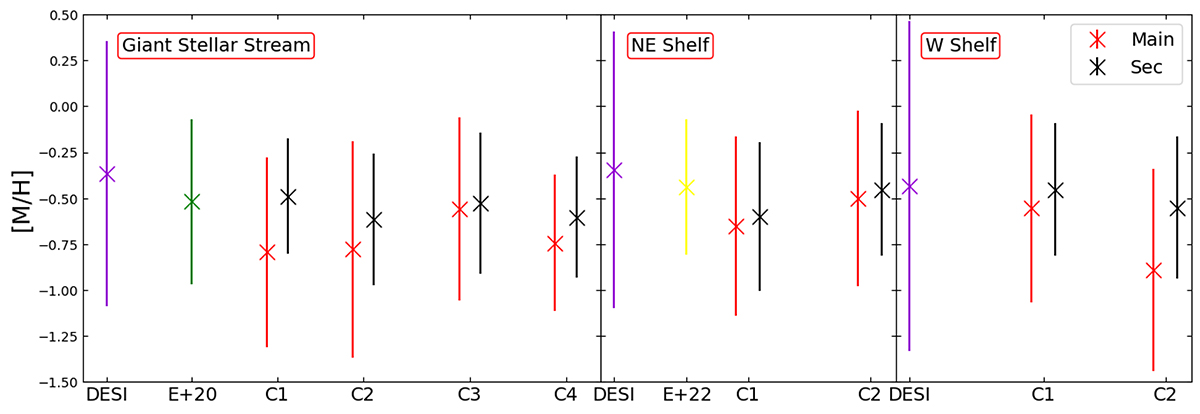
Fig. 13.
Download original image
Summary overview of the median metallicity values within GSS, NE and W shelves of the model to be compared with spectroscopic metallicity estimates from the DESI survey, Escala et al. 2020 (for the GSS; labelled as E+20 in the figure), and Escala et al. (2022) (for the NE shelf; labelled as E+22 in the figure). For each substructure, we report the median values from their components identified in the simulations by DBSCAN and labelled as C1, C2, etc. The error bars denote the standard deviation both for the data distributions and the distributions obtained from the simulation model.
Current usage metrics show cumulative count of Article Views (full-text article views including HTML views, PDF and ePub downloads, according to the available data) and Abstracts Views on Vision4Press platform.
Data correspond to usage on the plateform after 2015. The current usage metrics is available 48-96 hours after online publication and is updated daily on week days.
Initial download of the metrics may take a while.