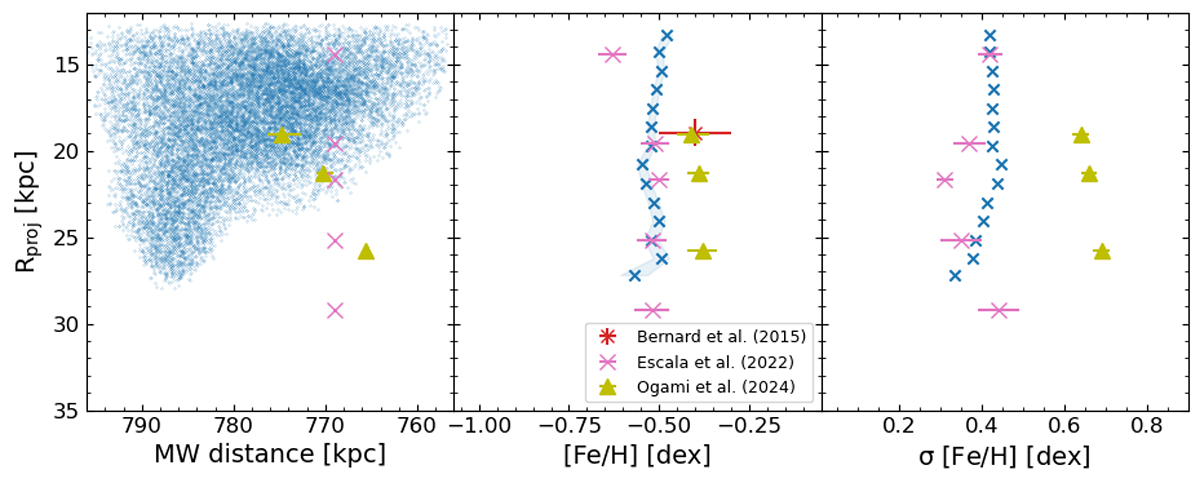
Fig. 15.
Download original image
Line-of-sight distribution, average metallicity and metallicity spread for NE shelf component[2], blue symbols. Ogami et al. (2025) data are shown as yellow triangles. The metallicity values and error bars from Escala et al. (2022) are shown in pink. Whenever they report two components in an observed field, their mean is plotted. The same MW distance of 769 kpc is assumed for all their NE shelf fields. Ogami et al. (2025) and Escala et al. (2022) assume a fixed age of 13 Gyr and 12 Gyr respectively. This critical assumption breaks down for distances near the M31 disc; see for example the age spread in Bernard et al. (2015). The Bernard et al. (2015) measurement is shown in red. For the projected distance, we have taken the average of the two fields for the NE shelf, while the relevant error corresponds to the size of each field.
Current usage metrics show cumulative count of Article Views (full-text article views including HTML views, PDF and ePub downloads, according to the available data) and Abstracts Views on Vision4Press platform.
Data correspond to usage on the plateform after 2015. The current usage metrics is available 48-96 hours after online publication and is updated daily on week days.
Initial download of the metrics may take a while.