Fig. 6.
Download original image
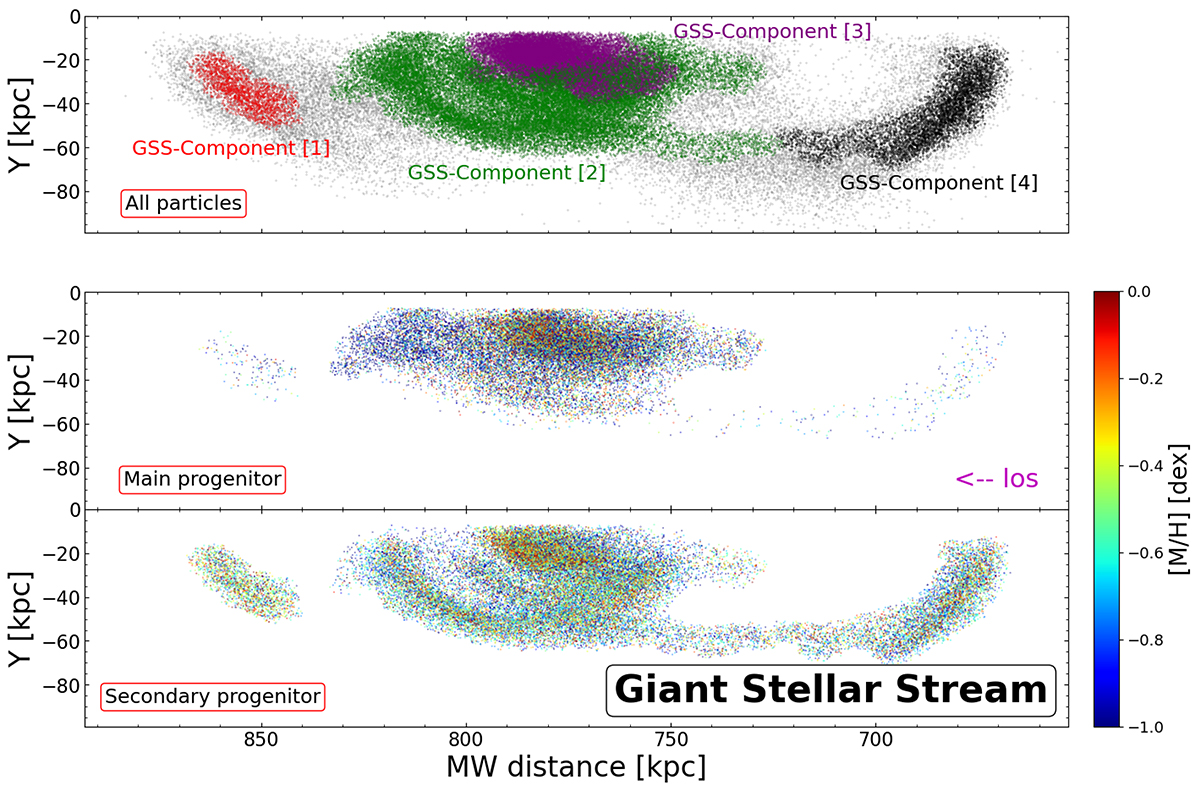
Upper panel: Illustration of the distribution along the LOS of all the stellar particles of the spatially selected GSS (see Figure 1), grouped into four numbered components by DBSCAN. Grey points are stellar particles that are not associated with any group of particles according to the DBSCAN clustering algorithm. The entire spatial distribution of the modelled GSS stars along the LOS is compared to independent observations in Figure 14. Particles in the upper panel are colour-coded according to their association with a DBSCAN component, as detailed in the legend. Middle panel: Particles originating from the main progenitor that belong to the identified components in the GSS. They are colour-coded by their metallicity. The grey particles shown in the upper panel are not included. Lower panel: Same as the middle panel, but for stellar particles which originate from the secondary progenitor.
Current usage metrics show cumulative count of Article Views (full-text article views including HTML views, PDF and ePub downloads, according to the available data) and Abstracts Views on Vision4Press platform.
Data correspond to usage on the plateform after 2015. The current usage metrics is available 48-96 hours after online publication and is updated daily on week days.
Initial download of the metrics may take a while.