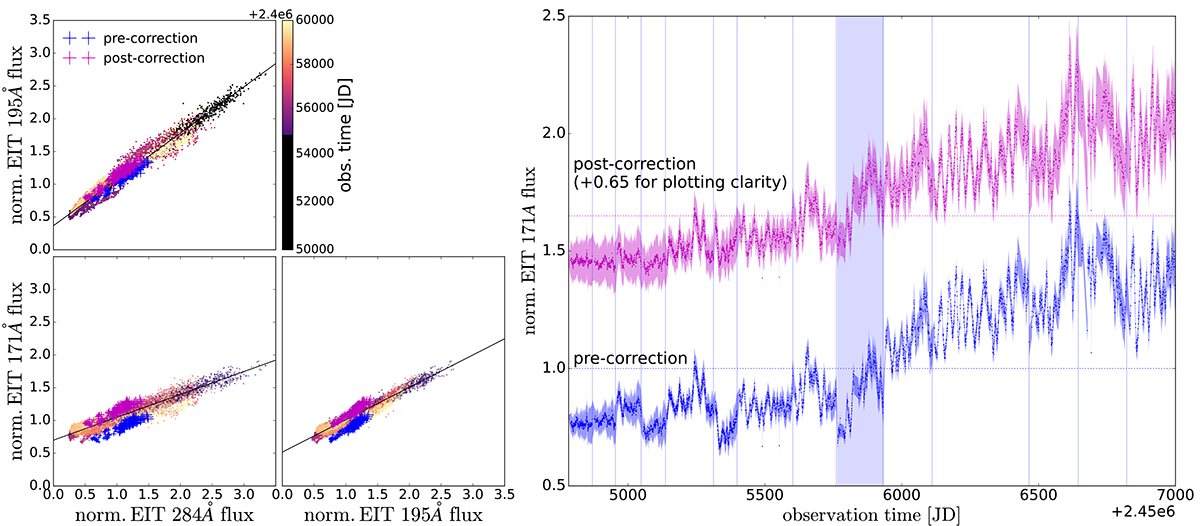
Fig. 10.
Download original image
Left: Scatter plots of the light curves in the EIT 171 Å 195 Å and 284 Å bands, after the initial corrections to the post-November 12, 2008, inter-bakeout segments are applied. All data points pre-November 12, 2008, are plotted in black; the later points are color-mapped by observation time. The uncertainties of the points are not plotted, for clarity. Straight lines show projections of the three-dimensional line of best fit to the pre-November 12, 2008, data. Blue plus symbols show the inter-bakeout segment between July 22, 2011, and January 6, 2012. Magenta plus symbols are the same inter-bakeout segment with additional constant offsets applied to move it closer to the line of best fit along the shortest possible vector. Right: Segment of the EIT 171 Å light curve, from November 12, 2008, to late 2014, when the bakeout discontinuities are most extreme. In blue is the light curve with only the initial bakeout correction applied; in magenta is the light curve with an additional constant offset added per bakeout. The magenta light curve is offset by +0.65 compared to the blue one for plotting clarity. The discontinuities across the bakeouts are much less extreme in the magenta version. The shaded region shows the inter-bakeout segment between July 22, 2011, and January 6, 2012, highlighted in the left panel.
Current usage metrics show cumulative count of Article Views (full-text article views including HTML views, PDF and ePub downloads, according to the available data) and Abstracts Views on Vision4Press platform.
Data correspond to usage on the plateform after 2015. The current usage metrics is available 48-96 hours after online publication and is updated daily on week days.
Initial download of the metrics may take a while.