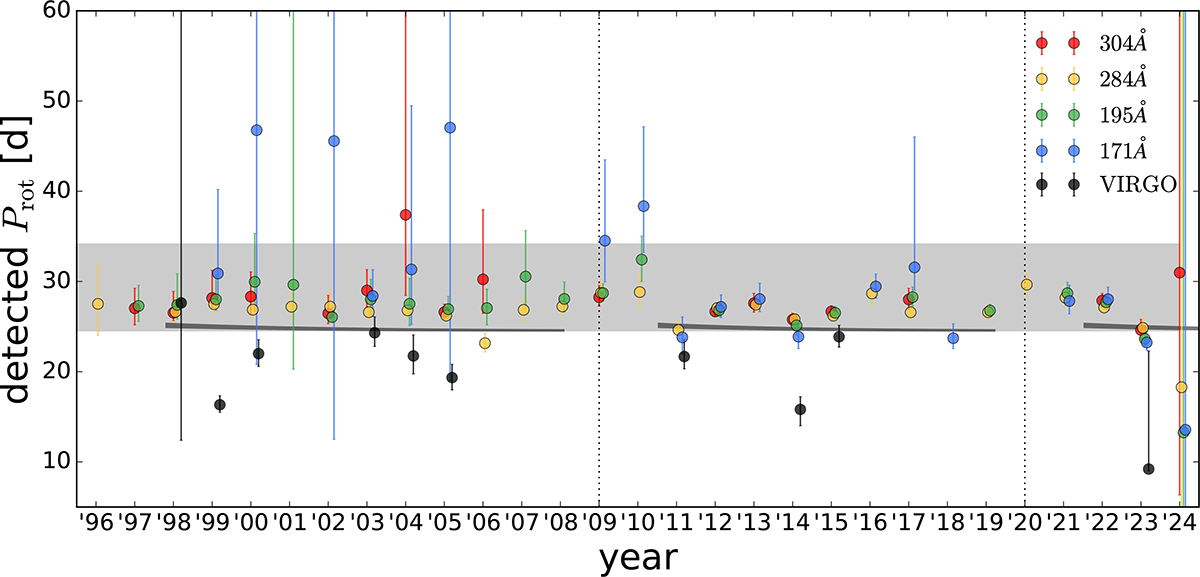
Fig. 14.
Download original image
Recovered rotation periods from a Gaussian process fit to segments of each EIT version (2) light curve and the VIRGO light curve, split up by calendar year of observation. Each band has a small x-offset for plotting clarity. The gray shaded band shows the range of the true solar rotation period, from equator to pole, calculated analytically from the solar differential rotation equation given by Snodgrass & Ulrich (1990). The near-horizontal black curves represent the average behavior of migrating sunspot groups over the solar activity cycle, as calculated by Jiang et al. (2011). The true solar rotation period can be recovered from the 284 Å light curve in 26 out of 29 years, and from the VIRGO light curve in only 3 out of 29 years.
Current usage metrics show cumulative count of Article Views (full-text article views including HTML views, PDF and ePub downloads, according to the available data) and Abstracts Views on Vision4Press platform.
Data correspond to usage on the plateform after 2015. The current usage metrics is available 48-96 hours after online publication and is updated daily on week days.
Initial download of the metrics may take a while.