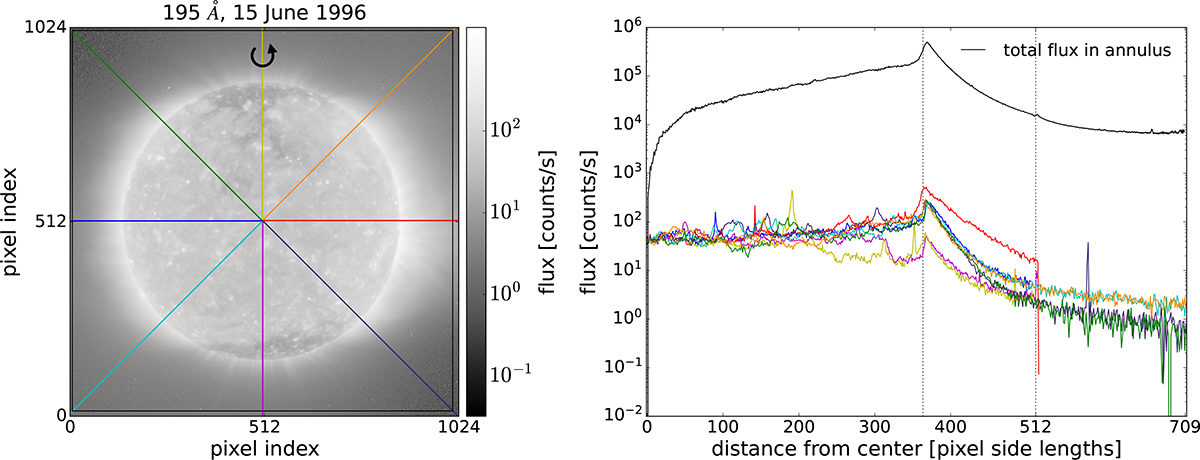
Fig. 6.
Download original image
Left panel: Example EIT 195 Å image taken on June 15, 1996. The curved arrow shows the direction of the solar rotation. The eight bisecting lines meet at the center of the solar disk, (icenter,jcenter). The image is color-mapped by the logarithmic flux value in each pixel in units of counts per second. The black square just inside the border of the image is the “trimmed” square of side length 2rpix centered at the center of the solar disk. Right panel: Flux value per pixel along each example bisecting line as a function of distance from (icenter,jcenter). Note that, beyond the solar limb at r≃363 (the leftmost vertical dashed line indicates the photospheric radius), the lines that intersect the solar poles (yellow and magenta) have much lower average flux per pixel than the other lines, due to significantly fainter coronal emission from a polar coronal hole. The black line with (barely visible) error bars is the total flux in each annulus from radius r = 1 to ![]() pixels and its associated uncertainty. The vertical dashed line at r = 512 indicates where annuli begin to overlap the edge of the image and our flux extrapolation begins.
pixels and its associated uncertainty. The vertical dashed line at r = 512 indicates where annuli begin to overlap the edge of the image and our flux extrapolation begins.
Current usage metrics show cumulative count of Article Views (full-text article views including HTML views, PDF and ePub downloads, according to the available data) and Abstracts Views on Vision4Press platform.
Data correspond to usage on the plateform after 2015. The current usage metrics is available 48-96 hours after online publication and is updated daily on week days.
Initial download of the metrics may take a while.