| Issue |
A&A
Volume 700, August 2025
|
|
|---|---|---|
| Article Number | A220 | |
| Number of page(s) | 12 | |
| Section | Extragalactic astronomy | |
| DOI | https://doi.org/10.1051/0004-6361/202346294 | |
| Published online | 28 August 2025 | |
XMM-Newton follow-up of a sample of apparent low-surface-brightness galaxy groups detected in the ROSAT All-Sky Survey
1
Argelander-Institut für Astronomie (AIfA), Universität Bonn, Auf dem Hügel 71, 53121, Bonn, Germany
2
National Astronomical Observatories (NAOC), Chinese Academy of Sciences, Beijing, 100101, China
3
School of Physics and Astronomy, Beijing Normal University, Beijing, 100875, China
4
Max-Planck-Institut für Extraterrestrische Physik, Gießenbachstraße 1, 85748, Garching, Germany
5
Leiden Observatory, Leiden University, PO Box 9513, 2300, RA Leiden, The Netherlands
⋆ Corresponding author: This email address is being protected from spambots. You need JavaScript enabled to view it.
Received:
1
March
2023
Accepted:
18
June
2025
Abstract
Context. Galaxy cluster cosmology relies on complete and pure samples that cover a large range of masses and redshifts. In our previous ROSAT All-Sky Survey (RASS)-based works, we discovered an apparently new population of galaxy groups and clusters with, on average, flatter X-ray surface brightness profiles than all other known clusters; this population was missed in previous cluster surveys. The discovery of such a new class of objects could have a significant impact on cosmological applications of galaxy clusters.
Aims. We aim to characterize a subsample of these systems to assess whether they belong to a new population.
Methods. We followed up on three of these galaxy groups and clusters with high-quality XMM-Newton observations. We produced clean images and spectra and used them for model fitting. We also identified known galaxies, groups, and clusters in the field.
Results. The observations reveal that all three systems are composed of multiple groups each, either at the same or at different redshifts. In total, we characterized nine groups. We measure flat surface brightness profiles with slope parameter β < 0.6, i.e, less than the canonical β = 2/3. For the two main central groups, we even measure β < 0.4. When the fluxes for the three observations are split up across the nine identified groups, none of them exceeds the typical flux limit adopted in previous RASS cluster catalogs, ≈3 × 10⁻¹² erg s−1 cm−2 in the 0.1 − 2.4 keV energy band.
Conclusions. The observations reveal that groups with flat surface brightness profiles exist. Determining whether they form a new, separate population requires additional follow-up observations of further systems from our previous RASS sample, given the complexity we have discovered. Such extended low-surface-brightness systems, as well as multiple systems and projection effects, need to be taken into account when determining the selection functions of group and cluster samples.
Key words: galaxies: groups: individual: RXGCC 127 / galaxies: groups: individual: RXGCC 841 / galaxies: groups: individual: RXGCC 507 / galaxies: groups: individual: RXGCC 104 / X-rays: galaxies / X-rays: galaxies: clusters
© The Authors 2025
 Open Access article, published by EDP Sciences, under the terms of the Creative Commons Attribution License (https://creativecommons.org/licenses/by/4.0), which permits unrestricted use, distribution, and reproduction in any medium, provided the original work is properly cited.
This article is published in open access under the Subscribe to Open model. This email address is being protected from spambots. You need JavaScript enabled to view it. to support open access publication.
1. Introduction
Galaxy groups and clusters are the largest virialized objects in the Universe. They represent a powerful probe of cosmological models (e.g., Schellenberger & Reiprich 2017a; Bocquet et al. 2024; Ghirardini et al. 2024), independent of other approaches such as those that make use of Type Ia supernovae (e.g., Kowalski et al. 2008) and the cosmic microwave background (CMB; e.g., Dunkley et al. 2009).
Cluster masses can be inferred using several independent methods (e.g., Schellenberger & Reiprich 2017b; Pratt et al. 2019; Grandis et al. 2024; Kleinebreil et al. 2025; Okabe et al. 2025) and can be used to build the halo mass function (e.g., Press & Schechter 1974; Sheth & Tormen 1999; Tinker et al. 2008). The halo mass function can be associated with the number density of galaxy clusters with a given mass, and its shape, normalization, and redshift evolution depend strongly on cosmology. To use galaxy groups and clusters for cosmological applications, it is crucial to have well-defined, large samples of clusters covering a wide range of masses and redshifts that are representative of the underlying population (e.g., Reiprich & Böhringer 2002; Allen et al. 2007; Vikhlinin et al. 2009; Planck Collaboration XXIV 2016; Bulbul et al. 2024). Clearly, accurate knowledge of completeness and purity is key as the fundamental observable is the cluster number density (e.g., Seppi et al. 2022; Clerc et al. 2024).
Some weak tensions between CMB measurements and some galaxy cluster measurements of the cosmological parameters ΩM and σ8 have long existed (e.g., Reiprich 2006 and references therein and Fig. 17 in Pratt et al. 2019). These tensions are usually referred to as S8 tension1. In essence, too few galaxy groups and clusters are detected for the given best-fit CMB values of ΩM and σ8, i.e., the mean normalized matter density and its fluctuation amplitude on a linear scale of spheres with 8 h−1 Mpc radius, where h is the normalized Hubble parameter. This raises the question of whether clusters and especially groups have been systematically missed by surveys.
Galaxy clusters can be observed in a number of wavebands; however, the X-ray band is especially useful as it allows us to observe and study the most massive visible component of clusters, the intracluster medium (ICM). The ICM is made up of gas with temperatures of up to about Tgas = 108 K, and this gas emits mostly through thermal bremsstrahlung in the X-ray band with the emissivity being proportional to the density squared. The detection of this gas allows us to trace the presence of gravitationally bound structures. This makes X-ray imaging one of the most reliable methods for detecting clusters and groups because it is least affected by projection effects.
In Xu et al. (2018, 2022) (hereafter X18 and X22 respectively) we set out to test if cluster surveys based on the ROSAT All-Sky Survey (RASS), a survey carried out with the ROSAT telescope with a spatial resolution ∼1′ and low particle background, might have failed to detect a class of galaxy groupscharacterized by an unusually large extension, low surface brightness, or flat surface brightness profile. These characteristics would make it hard for such groups to be revealed using the detection method commonly used for most of the cluster samples built from RASS data. The sliding cell algorithm (Harnden et al. 1984) is well suited to detect point sources, but it may fail in identifying extended, low-surface brightness-objects. By applying the detection method based on wavelet-filtering presented in Pacaud et al. (2006) to RASS observations, many low redshift galaxy groups were identified at positions where no X-ray source had previously been detected. A pilot sample of 13 such objects is presented in X18. The full sample includes 944 clusters – of which 303 were discovered through their ICM emission for the first time, and 149 had never been detected as galaxy clusters before in any waveband – and is described in X22. If confirmed, the incompleteness of group and cluster samples could be higher than estimated, which could have important consequences for cosmology, as discussed in detail in Schellenberger & Reiprich (2017a, their Section 4.3.1). Therefore, we study a subsample of these systems with high-quality XMM-Newton follow-up observations here.
We selected four of the galaxy groups from the pilot sample whose X-ray fluxes are close to the nominal flux limits of previous RASS cluster catalogs (≈3 × 10⁻¹² erg s−1 cm−2 in the 0.1 − 2.4 keV energy band) to be followed up on by XMM-Newton. The observation of one of them (RXGCC 507, referred to as Observation 4 in this work) turned out to be completely flared; therefore, we focused here on RXGCC 127, RXGCC 841, and RXGCC 104 in X22, which in this work are referred to as Observations 1, 2, and 3, respectively. Their observation IDs, coordinates, and estimated redshifts according to the RASS detection are summarized in Table 1. Fig. 1 shows the RASS and XMM-Newton images for our targets plus additional information as described in the caption.
XMM-Newton observation ID, clean exposure time, coordinates, and estimated redshift for our sample according to the RASS detection (X22, https://github.com/wwxu/rxgcc.github.io).
In Sect. 2 we discuss the XMM-Newton data reduction steps. We describe our imaging analysis in Sect. 3, and our surface brightness and spectral analyses in Sect. 4. In Sect. 5 we present and discuss the results, and in Sect. 6 we summarize the main conclusions of this work. Throughout this paper we assume a flat Λ cold dark matter cosmology with H0 = 70 km s Mpc−1, ΩM = 0.3, and ΩΛ = 0.7.
2. Data reduction
Data reduction and analysis were performed using HEASoft version 6.25 and Science Analysis Software (SAS) version 18.0.0 (xmmsas_20190531_1155). The procedure is the same as described in Veronica et al. (2022) for the XMM-Newton data. Therefore, we provide only a short summary here.
As a first step, we reduced and calibrated the event lists for the four targets observed with the XMM-Newton telescope in AO19 (P.I.: Thomas H. Reiprich). In particular, we calibrated photons in terms of energy and position in the sky, and we performed a flare filtering operation that consists of identifying good time intervals by discarding those that are contaminated by soft proton flares (De Luca & Molendi 2004; Kuntz & Snowden 2008). A light curve and the corresponding count histogram were generated for each detector. A Poisson law was fitted to the histogram and time intervals falling outside ±3σ were rejected. To check for residual soft proton flare contamination, we carried out the IN/OUT ratio test (De Luca & Molendi 2004; Leccardi & Molendi 2008) in the soft and hard X-ray bands. A flare-free IN/OUT ratio should be close to unity. Unfortunately, Observation 4 failed the test with an IN/OUT ratio > 1.15 and thus is not used for the analysis. In Observations 1, 2, and 3, contamination by soft proton flares was mostly eliminated, leaving 10 − 20 ks of good exposure time each.
Secondly, we checked the status of single chips in MOS1 and MOS2 since some of them might behave anomalously and show an unusually low hardness ratio and a particularly high background rate (Kuntz & Snowden 2008). This resulted in MOS1-4 being removed in Observation 2. In addition, MOS1-3 and MOS1-6 were not in use during Observations 1, 2, and 3. For the background treatment, we followed the procedure described in Ramos-Ceja et al. (2019) and Migkas et al. (2020). We obtained background-subtracted and exposure-corrected images in the 0.4 − 1.25 keV energy band for Observations 1, 2, and 3, which enabled a visual inspection of the targets.
The next step was the masking of point sources in the field of view (FoV), which can contaminate the morphological, photometric, and spectral analysis of the groups. This was done following the procedure described in Pacaud et al. (2006): first a wavelet filtered image for the combined detectors in the 0.5 − 2 keV energy band was generated, then the Source Extractor (SExtractor) software (Bertin & Arnouts 1996) was applied to detect point sources in the FoV and stored them in a catalog. After that, we checked the preliminarily cleaned images and manually added any missed point sources to the catalog. The manual inspection was done both in the hard (2 − 10 keV) and in the soft X-ray band (0.5 − 2 keV). This final catalog was then used in both imaging and spectral analyses to remove the unwanted sources. Once the point sources were removed, the area was refilled with random background photons for display purposes.
3. Visual inspection and optical galaxy redshifts
In this section, we describe how we associated known galaxy clusters in our three XMM-Newton observations with detected extended X-ray sources. For this, we made use of the RASS and XMM-Newton images shown in Fig. 1. Note that the extent (red circle in the RASS images), which represents the core radius from a maximum likelihood fitting of a beta model, is always smaller than the significance radius within which cluster emission was significantly detected, and also always smaller than R500 within which the fluxes were determined in X22. We also recorded the redshift, zassoc, of associated clusters. Furthermore, we determined optical redshifts for the extended X-ray sources, zopt, from known galaxy redshifts in the fields. We used the NASA/IPAC Extragalactic Database (NED) galaxy redshift information of the most likely members of the identified extended sources to calculate the median redshift. Additionally, we determined the median absolute deviation and scaled it to correspond to a 1σ Gaussian error. We took these values as their optical redshifts and uncertainties. In Sect. 5 we also provide X-ray redshifts, zX − ray, when possible. A summary of all redshifts for all groups and clusters, as well as the final adopted redshift, is provided in Table 2.
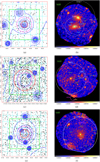 |
Fig. 1. The red circles in the RASS photon images (left, in the 0.5 − 2 keV energy band) indicate the position and extent of the detection from X22. The dashed magenta circles show the FoV of the XMM-Newton observation, and the green boxes serve as a 1° ×1° ruler. The blue contours show the smoothed signal from the wavelet filtered images used to detect the source. The XMM-Newton count-rate images (right, 0.4 − 1.25 keV) are instrumental-background-subtracted and smoothed by a 7.5′′ Gaussian kernel. The labels indicate the position of the main sources discussed in the paper. The white circles mark the R500 (0.5 R500 when dashed) of the groups that we determined in this study (Sect. 4). Magenta circles around known galaxy clusters have an arbitrary size of 2′. Matching known galaxies from NED are marked with small circles of various colors and were used for group and cluster redshift estimates (Sect. 3): Panel b: for Group 1 in green and Group 2 in cyan. Panel d: for Group 3 none, AS0924 and A3742 in green, and A3745 in yellow. Panel f: for Group 4 and [TKK2018] 859 in green and A0349 in yellow. (a) RASS image of RXGCC 127. (b) XMM-Newton image of RXGCC 127. (c) RASS image of RXGCC 841. (d) XMM-Newton image of RXGCC 841. (e) RASS image of RXGCC 104. (f) XMM-Newton image of RXGCC 104. |
3.1. Observation 1 (RXGCC 127): Group 1 and Group 2
In the XMM-Newton image of Observation 1 (Fig. 1b), one notices the emission from two bright extended X-ray sources close to the center of the pointing. The northern object, which we call Group 1 from now on, could, in principle, be associated with a previously identified galaxy group: USGC S110 at z ∼ 0.012 (Mahdavi et al. 2000); this redshift is also similar to the redshift associated with RXGCC 127 in X22 (zassoc = 0.012). However, the central coordinates of USGC S110 (RA, Dec) = (46.0463, −12.0842) are far from the X-ray center of Group 1 (6.9′ offset), but instead are much closer to the X-ray center of the southern source, which we call Group 2 (angular separation of 1.9′).
We find eight potential galaxy members of Group 1 in NED within the FoV (green dots in Fig. 1b), with redshifts ranging between 0.011 and 0.030. For Group 1, we obtain zopt = 0.013 ± 0.002. We note that NGC 1200 (z = 0.0135; Wegner et al. 2003) is located at the center of Group 1 and might be the brightest cluster galaxy (BGG) of the group. Furthermore, we find 11 galaxies that potentially belong to Group 2 (cyan dots in Fig. 1b). The galaxies are located at 0.086 ≤ z ≤ 0.136. The median redshift is zopt = 0.102 ± 0.014. The WISEA J030405.18−120612.1 galaxy (z = 0.092) coincides with the X-ray peak of Group 2. Given that clear association with USGC S110 can be made for either Group 1 (no close coordinate match) or Group 2 (no close redshift match), we kept their names.
3.2. Observation 2 (RXGCC 841): Abell S0924, Group 3, Abell 3742, and Abell 3745
Observation 2 is shown in Fig. 1d. The presence of multiple extended sources is striking. On NED, three galaxy clusters are identified in the field, Abell S0924 at zassoc ∼ 0.016 (Coziol et al. 2009), Abell 3742 also at zassoc ∼ 0.016 (Abell et al. 1989; Struble & Rood 1999), and Abell 3745 with unknown redshift.
We detect well-centered diffuse X-ray emission for AS0924, as well as for A3742 albeit with an offset of about 2.5′, (RA, Dec) = (316.674, −47.149); such an offset is not unusual given the large uncertainty of Abell cluster positions. Even modern optical cluster centers are often offset from X-ray centers; e.g., Seppi et al. (2023) find an average offset of about 80 kpc, which corresponds to almost 4′ at the redshift of A3742. The third cluster, A3745, can also be associated with extended X-ray emission at the southern edge of the XMM-Newton FoV.
We find ten galaxies with known redshifts in the range 0.0162 ≤ z ≤ 0.0476, which could potentially belong to AS0924 or A3742. From this, we formally obtain zopt = 0.032 ± 0.0183. However, note that the NGC 7014 galaxy (z = 0.0162) sits at the center of AS0924, which is consistent with being the BCG of the cluster as reported in Coziol et al. (2009). Smith et al. (2000) associated six galaxies with spec-z in a large field with A3742, including ESO 286-G049 (z = 0.0177); this galaxy coincides with our X-ray peak of A3742, and it seems reasonable to assume it to be the BCG.
Close to 0.5 R500 of AS0924 (white dashed circle in Fig. 1d) and also to A3472 (magenta circle, centered on the X-ray peak), we identified another clump showing extended X-ray emission, and we refer to it as Group 3 (white circle). For Group 3, no galaxies with known redshifts are found in its vicinity.
For A3475, we find three galaxies of similar photometric redshift located within ∼2.7′ from the cluster center (yellow dots in Fig. 1d). The median redshift of these galaxies is zopt = 0.130 ± 0.003.
3.3. Observation 3 (RXGCC 104): Group 4, A0349, and [TKK2018] 859
In Observation 3, XMM-Newton data reveal the presence of three extended emission regions. One is close to the center of the pointing, with a slight offset toward the southwest. We associated this with the central part of RXGCC 104 (X22), and we call it Group 4 from now on. The reason for the center offset is likely due to the point source northeast of Group 4 that was not de-blended in the RASS analysis (Fig. 1e). We identify 16 galaxies in the field, possibly members of Group 4, for which redshift estimates are available in NED spanning the range z ∼ 0.028 to z ∼ 0.042, which, if interpreted as comoving distance, corresponds to 119 Mpc and 178 Mpc. From this redshift information, we obtained zopt = 0.037 ± 0.004. Situated at the center of Group 4 is the UGC 01877 galaxy (RA, Dec = 36.409, 36.964). With z = 0.036 (Huchra et al. 1999), this galaxy is likely the brightest group galaxy (BGG) of the group.
Extended emission is also visible in the northern and southern outskirts of the FoV. The southern emission can be attributed to the galaxy cluster Abell 0349 (Abell et al. 1989). The redshift of this cluster is unknown, and it is quite challenging to conclude whether the identified galaxies in the field are members of Group 4 or A0349. One galaxy of known redshift (WISEA J022620.10+364931.7; z = 0.128) is found in NED, located near the center of A0349. Assuming that thecluster is at this redshift, the ∼8′ apparent extension translates to 1.1 Mpc. We also find three other galaxies with redshifts similar to that of WISEA J022620.10+364931.7 (yellow dots in Fig. 1f). Using these four galaxies, we obtain zopt = 0.136 ± 0.017. Another galaxy of known redshift is also found in the perimeter of A0349: WISEA J022609.70+364704.2 located at (RA, Dec) = (36.540, 36.785) and z = 0.0322 (green dot close to A0349 in Fig. 1f).
In addition, there is a low-significance detection of X-ray emission in the northern region, close to the edge of the FoV. Tempel et al. (2018) compiled a catalog of galaxy groups using a Bayesian group-finding technique based on marked point processes applied to the Two Micron All Sky Survey (2MASS; Skrutskie et al. 2006) Redshift Survey (2MRS; Huchra et al. 2012) dataset. Using this catalog, we identified the [TKK2018] 859 galaxy group near the northern emission. This group is centered at (RA, Dec) = (36.387, 37.148), which corresponds to the center of the northern magenta circle in Fig. 1f. It has a spectroscopic redshift of 0.036, and it is associated with eight galaxies, four of which lie within the FoV. Since [TKK2018] 859 and Group 4 are at similar redshifts, it is challenging to distinguish which galaxies within the FoV belong to which group. Therefore, we used the same zopt = 0.037 estimate for the two. For completeness, Ramella et al. (2002) lists the optically selected galaxy group USGC U118 at (RA, Dec) = (36.404, 37.123), just 1.7′ away from [TKK2018] 859. The quoted redshift for this group, z = 0.035, is consistent with the one for [TKK2018] 859. We also note that since the extended emission regions we associated with the A0349 cluster and the [TKK2018] 859 group are too close to the edge of the XMM-Newton FoV, we could not reliably determine their X-ray centers; therefore, we report their literature centers (Table 2).
Summary of the galaxy group and cluster properties.
4. X-ray analysis
The surface brightness analysis as well as the spectral analysis are performed on the masked images before the refilling operation. For the surface brightness analysis, we firstperformed a consistency check between the fluxes measured by the two instruments, ROSAT and XMM-Newton, by comparing the growth curve in X18 with the one we determined from the XMM-Newton images. To compare them, we centered the profiles on the same point, i.e., the center of the pointing. The analysis is performed in the 0.5 − 2 keV energy range and the bin width used is 30′′.
Then, we focused on individual groups observed in the XMM-Newton pointings. We built surface brightness profiles centering on the X-ray emission peak. When needed, we masked the side of the source facing any nearby bright extended source (e.g., in the case of Group 1 and Group 2). Using lmfit (Newville et al. 2014), we modeled the surface brightness profiles with a single β model (Cavaliere & Fusco-Femiano 1976, 1978), as it generally provides a reasonable representation of the observed surface brightness for clusters and groups, and because we want to obtain a simple parameter that describes the slope of the profiles. We also estimated the unabsorbed flux contribution. This last step allowed us to check whether the flux measured for each source is above or below the limit set for previous RASS-based cluster catalogs.
In this work, we performed spectral analysis using XSPEC version 12.10.1 (Arnaud 1996). The energy band we considered for the spectral analysis of all targets covers the range 0.5 − 7 keV. For each camera, we modeled and subtracted the instrumental background based on rescaled filter-wheel-closed observations. In our initial modeling, we observed suspicious residual emission at high energy in most MOS1 spectra. Since, despite extensive checks, we could not identify any trace of residual particle flare contamination, nor any issue with the other cameras, we conclude that the residuals result from inconsistencies between our templates for the MOS1 instrumental background and the real data. We therefore excluded MOS1 from subsequent spectral analyses. This reduction of ∼15% of effective exposure time does not affect the precision of our results significantly.
The spectral model that was fit to the data has two terms, i.e., Model = constant(apec1 + phabs(apec2 + powerlaw)+gaussian1 + gaussian2)+phabs × apec3. The first term is used to fit the cosmic X-ray background and the residuals of the instrumental lines, rescaled to the area of the regions employed for spectral extraction in arcmin2 (constant). The first apec model, apec1, accounts for the emission coming from the Local Hot Bubble. The emission from the Milky Way halo and the unresolved active galactic nuclei are modeled by apec2 and powerlaw, respectively. The absorption along the line of sight due to the hydrogen column density is accounted for by the phabs model. The total hydrogen column density, which includes neutral and molecular hydrogen, is given by Willingale et al. (2013) (see Table 3).
Starting values for the parameters describing the cosmic X-ray background in our spectral model.
The Gaussian components that were included in the model account for emission from the main fluorescence lines present in the instrumental background. Indeed, these are time variable, and possible residuals can remain in the background-subtracted spectra. For the MOS2 detector, these include Al Kα at 1.4865 keV and Si Kα at 1.74 keV. For the PN, only Al Kα is modeled (while the normalization of the other line is fixed to zero). During spectral fitting, the energies and (zero) widths of the emission lines were fixed, while their normalization was free to vary.
Finally, the second term, phabs × apec3, is used to model the absorbed cluster emission. Unless specified otherwise, temperature, metallicity, and normalization of apec3 are linked between MOS2 and pn and are free to vary during the spectral fitting to estimate these quantities for each cluster or group in our sample.
For each observation, we needed to model the sky background. To do so, the spectrum from a region where cluster emission does not dominate is required. Since we expect the studied galaxy groups to be rather extended, sky background spectra were extracted from ROSAT data in the surroundings of the XMM-Newton pointings. In particular, the same annular regions used in X18 for the sky background estimate were considered.
The number of X-ray clumps revealed by our XMM-Newton observations coinciding with the RASS detections in X22 adds some ambiguity in the X-ray to optical association process and redshift determination. In addition, Groups 1–4 could not be clearly associated with a previously known optical group. Therefore, whenever possible, we also derived an X-ray redshift for each source from our spectral fits. Usually, this required extracting a spectrum for the higher signal-to-noise core emission (the exact aperture was estimated on a cluster-by-cluster basis based on visual inspection). For Group 1 and 2 we used circular regions with 1′ radius centered on their X-ray peak. In each case, half of the aperture was masked to exclude contamination from the other group. For Group 3, the circular region from which we extracted the spectrum needed to be larger to have enough statistics to fit a redshift value from the source spectrum. With a radius of 1.6′ centered at (RA, Dec) = (316.761, −47.140), we encompass most of the group emission and avoid contamination from surrounding clusters.
Since the redshift of A0349 in Observation 3 was not available in the literature, we also obtained an X-ray redshift estimate for this cluster by extracting and fitting a spectrum from a circular region of radius 2′ centered at (RA, Dec) = (36.500, 37.005). The spectrum extraction region was selected in such a way that we maximized the signal-to-noise ratio and avoid contamination from Group 4. Since the cluster is only partially covered and may not be properly centered, we do not report the measured temperature.
We estimated the size of each cluster by deriving R500 iteratively using core-excised temperatures within 0.2 − 0.5 R500 and applying the Lovisari et al. (2015)M500 − T relation. To estimate errors of the resulting R500, we took the statistical uncertainty of the temperature into account but neglected the intrinsic scatter of the M500 − T relation as well as uncertainties of the average relation. Emission from nearby groups was masked in the process. For AS0924, we excluded the entire western half for this reason. Furthermore, 0.5 R500 partially exceeds the usable XMM-Newton FoV for AS0924, resulting in the estimated temperature being weighted more toward the inner regions.
Group 3 represents a special case due to low counts and proximity to other sources. Therefore, we iteratively used the surface brightness profile to determine LX and employed the LX − M500 relation from Lovisari et al. (2015) to derive R500. As a consistency check, this alternative procedure was also applied to the other groups and yielded similar results within a large scatter. Due to the low number of counts, for Group 3, the reported temperature was determined within a region of 1.6′ radius.
5. Results and discussion
We summarize the results of the analysis carried out in this work in Table 2. The table is divided into three parts, corresponding to the three XMM-Newton observations of RXGCC 127, 841, and 104. The redshifts determined by X22 are also provided in the header rows. Column 1 contains the names of all nine galaxy groups. The coordinates (Cols. 2 and 3) for Groups 1–4 are the X-ray centers as determined with the XMM-Newton observations here. This is also true for A3742 and AS0924. For the other groups, the literature coordinates are given because they are too close to the edge of the XMM-Newton FoV. The next two columns contain the redshifts determined in Sect. 3, zopt and zassoc. In Col. 6, we list the redshift obtained from X-ray spectral fitting (Sect. 4); further details on zX − ray, as well as on the finally adopted redshift (indicated in Col. 7), are provided below. Columns 8–11 show the determined X-ray temperatures, M500, and R500 (given in both arcminutes and kiloparsecs; see Sect. 4 for how they were determined). The best-fit β values from the surface brightness profile analysis (Sect. 4) are given in Col. 12. Finally, background-subtracted, unabsorbed fluxes measured in two energy bands are provided in Cols. 13 and 14.
In the observation of RXGCC 127 (zX22 = 0.012), we clearly detect two very distinct galaxy groups, called Group 1 and Group 2. The redshift analyses in Sects. 3 and 4 reveal that these two groups reside at two very different redshifts and are, therefore, not physically connected. For Group 1, we determined zopt = 0.013 ± 0.002, which coincides almost exactly with the redshift determined by X22, zassoc. From the X-ray spectral analysis, we found  , which is also consistent. We therefore adopted zopt = 0.013 for Group 1. We find that Group 2 is at a higher redshift, with consistent optical and X-ray redshifts, zopt = 0.102 ± 0.014 and
  ; we adopted the latter value.
From its temperature, kBT = 0.84 ± 0.06 keV, we derived that Group 1 is a low-mass group with M500 just above 1013 M⊙ (see Table 2). Its surface brightness profile is slightly flatter than the canonical β = 2/3. On the other hand, Group 2 is hotter,  keV, and, therefore, more massive, just above 1014 M⊙, as expected given the higher redshift. Its surface brightness profile, β = 0.53 ± 0.03, is significantly flatter than 2/3 but still above 1/2.
The XMM-Newton observation of RXGCC 841 (zX22 = 0.016) reveals that it is composed of four galaxy groups exhibiting extended X-ray emission: AS0924, Group 3, A3742, and A3745. While the X-ray and optical redshifts of AS0924 are rather close to each other ( ; zopt = 0.032 ± 0.018), we decided to adopt zassoc = 0.016 as the final redshift for this system because of the redshift of the central galaxy (NGC 7014, z = 0.0162), which is within 1σ of both zX − ray and zopt. Since for Group 3 we only have the X-ray redshift,
  , we adopted it. The X-ray signals of A3742 and A3745 are too faint to estimate X-ray parameters. We adopted zassoc = 0.018 for A3742 because of the coincidence of galaxy and X-ray peak. This redshift is also consistent within 1σ with zopt = 0.032 ± 0.018. For A3745, we adopted zopt = 0.130 ± 0.003.
We find low temperatures for AS0924 and Group 3:  keV and
  keV, respectively. This results in group-like masses of a few times 1013 M⊙. With β = 0.53 ± 0.05 the surface brightness slope for Group 3 is as flat as those of Group 1 and 2. Even more striking is the β = 0.36 ± 0.02 for AS0924. For example, in the ∼100 bright nearby groups and clusters in HIghest X-ray FLUx Galaxy Cluster Sample (HIFLUGCS; Reiprich & Böhringer 2002), not a single system has such a small value of β, although low β values are not unheard of for some of the lowest-mass groups and elliptical galaxies (e.g., Sanderson et al. 2003).
In the observation of RXGCC 104 (zX22 = 0.036), we detect three extended X-ray emission regions: Group 4, A0349, and [TKK2018] 859. For the centrally located Group 4, all three redshift estimates, zopt, zX − ray, zassoc, are consistent with each other, and we adopted zassoc = 0.036 from X22. For A0349, no associated redshift is available but zopt and zX − ray are consistent, and we adopted  . As described in Sect. 4, since A0349 is only partially covered and may not be properly centered, we do not report a measured temperature. No X-ray parameters could be determined for [TKK2018] 859 but our optical redshift estimate, zopt = 0.037 ± 0.004, is consistent with zassoc = 0.036 from Tempel et al. (2018), and we adopted the latter.
Our temperature estimate of ∼1.5 keV for Group 4 results in M500 ≈ 5 × 10¹³ M⊙. Also, Group 4 exhibits a strikingly flat surface brightness profile, β = 0.39 ± 0.01.
We next turned to the flux measurements of the galaxy groups. First, Fig. 2 shows the result of the flux comparison between ROSAT and XMM-Newton in the case of the observation of RXGCC 127. One can see that the flux measurements are consistent at all radii, except within the inner ∼2′, where the broader ROSAT PSPC point spread function distributes some flux from inner to outer regions. From this test, we conclude that the two instruments measure the same flux within the usable XMM-Newton FoV; i.e., within 12′.
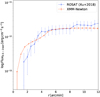 |
Fig. 2. Flux comparison of ROSAT and XMM-Newton for the observations of RXGCC 127 in the 0.5 − 2 keV energy range. The integrated-flux profiles are background-subtracted. |
Based on the RASS observation, X22 had associated the measured flux of RXGCC 127 with a single galaxy group at z = 0.012. The much higher quality XMM-Newton image shows that the flux contribution instead comes from two distinct extended sources at different redshifts, namely Group 1 and Group 2. Similar cases have been presented in Ramos-Ceja et al. (2019) and Reiprich et al. (2004), where follow-up XMM-Newton observations had revealed that the limited RASS spatial resolution (∼1 arcmin) and photon statistics had caused some double or triple clusters, or unrelated clusters with small projected separation, to be identified as a single source.
Since XMM-Newton allowed us to distinguish the two sources from which the ROSAT flux is measured, we are interested in estimating the contribution of each of them to the total. The surface brightness profiles were built as described in Sect. 4. Then we integrated the profiles, which are shown in Fig. 3 for Group 1. We integrated up to the radius at which the sky background emission starts to become dominant. Integrated flux profiles, and their best-fit β models, for Group 2, AS0924, Group 3, and Group 4 can be found in Appendix A.
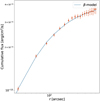 |
Fig. 3. Cumulative sky-background-subtracted flux in the 0.5 − 2 keV energy band and the best-fit β model for Group 1. |
In Table 2 we list all our flux measurements and the best-fit β values. The estimated fluxes all lie below the typical flux limit of previous RASS-based galaxy cluster surveys (i.e., ≈3 × 10¹² erg s−1 cm−2 in the 0.1 − 2.4 keV energy band). Given our finding that the RASS-measured fluxes need to be split into two (RXGCC 127), three (RXGCC 104), or even four (RXGCC 841) individual galaxy groups, this is not surprising. In some sense, this is good news for the previous RASS-based cluster surveys, as the systems characterized here do not make it above their flux limits. On the other hand, our results show again that projection effects can also affect X-ray selected cluster samples. Moreover, the groups identified here exhibit rather flat X-ray surface brightness profiles. In particular, the two main central groups, AS0924 and Group 4, have β < 0.4. This demonstrates the need to account for such systems, as well as for projection effects, when studying the selection effects in X-ray clustersurveys.
6. Summary of conclusions
We performed X-ray imaging, surface brightness, and spectral analyses of an XMM-Newton subsample of galaxy groups found during a reanalysis of the RASS (X18; X22). This reanalysis revealed the presence of several extended X-ray sources that had been missed in the past, despite their measured fluxes being similar to the flux limits applied in previous RASS cluster catalogs. Some of these sources did not even have any X-ray detections in any X-ray catalog. With our XMM-Newton analysis of a subsample, we wanted to test whether these sources had been overlooked in the past because they exhibit very extended, flat surface brightness profiles, for which some of the major source detection algorithms are not optimized.
The answer, based on this limited subsample, is yes and no. Our main results and conclusions are the following.
-
The XMM-Newton observations indeed reveal that the central groups (AS0924 and Group 4) of two out of the three analyzed observations (RXGCC 104 and RXGCC 841) have a very flat surface brightness profile with a slope parameter β < 0.4.
-
The RASS flux of these two observations measured by X22 is decomposed into flux contributions from a total of seven individual groups. Out of these additional five groups, two (A3742 and [TKK2018] 859) appear to be at the same distance as the respective main central group, while three (A3745, Group 3, and A0349) seem to just happen to lie projected along the line of sight.
-
Observation 1, pointed at RXGCC 127, reveals two groups with similar fluxes (Group 1 and Group 2). These two groups are shown to be at different distances and so are not physically connected. With β < 0.6, they both also show a flat, albeit not extremely flat, surface brightness profile.
-
The individual fluxes of these nine groups with extended X-ray emission all fall below the typical RASS cluster survey flux limits. So, strictly speaking, they are not missing from previous RASS-based cluster catalogs.
-
Nonetheless, the main central groups do feature unusually flat surface brightness profiles, so the existence of such groups needs to be taken into account when determining selection functions, in particular for surveys with a source detection process optimized for point sources.
-
Also, our analysis demonstrates that the vicinity of other groups at the same or a different redshift can affect a resulting cluster catalog, since several sources may be blended and detected as a single source in a cluster detection process with few photons and moderate spatial resolution. For example, if the goal is to constrain the redshift-dependent cluster mass function, not accounting for such a source type would result in an underestimate of the number density and would probably result in an overestimate of the mass and, possibly, an incorrect redshift.
-
Our conclusions are based on a small set of follow-up observations of systems discovered by X18 and X22 and may, therefore, not be fully representative. Therefore, obtaining further XMM-Newton follow-up observations to corroborate the findings here would be useful. A representative subsample of about 25 systems from Xu et al. (2022) should suffice. Extrapolating from the current study (four observations performed with an average total observing time of about 17 ks each, three of which fulfill the quality criteria), a reasonable XMM-Newton investment of about 500 ks would be required, which appears feasible. Moreover, for groups at high redshifts, the future NewAthena X-ray observatory will be able to detect and characterize such systems (Pointecouteau et al. 2013; Cruise et al. 2025).
 .
.
Acknowledgments
CS, AV, and TR acknowledge support from the German Federal Ministry of Economics and Technology (BMWi) provided through the German Space Agency (DLR) under project 50 OR 2112. AV acknowledges funding by the Deutsche Forschungsgemeinschaft (DFG, German Research Foundation) – 450861021. WX thanks the support of National Nature Science Foundation of China (Nos. 11988101, 12022306, 12203063), the support by National Key R&D Program of China No. 2022YFF0503403, the support from the Ministry of Science and Technology of China (No. 2020SKA0110100), the science research grants from the China Manned Space Project (Nos. CMS-CSST-2021-B01, CMS-CSST-2021-A01), CAS Project for Young Scientists in Basic Research (No. YSBR-062), and the support from K.C. Wong Education Foundation. KM acknowledges support in the form of the X-ray Oort Fellowship at Leiden Observatory. Based on observations obtained with XMM-Newton, an ESA science mission with instruments and contributions directly funded by ESA Member States and NASA.
References
- Abell, G. O., Corwin, H. G., & Olowin, R. P. 1989, ApJS, 70, 1 [Google Scholar]
- Allen, S. W., Rapetti, D. A., Schmidt, R. W., et al. 2007, MNRAS, 383, 879 [CrossRef] [Google Scholar]
- Arnaud, K. A. 1996, ASP Conf. Ser., 101, 17 [Google Scholar]
- Bertin, E., & Arnouts, S. 1996, A&AS, 117, 393 [NASA ADS] [CrossRef] [EDP Sciences] [Google Scholar]
- Bocquet, S., Grandis, S., Bleem, L. E., et al. 2024, Phys. Rev. D, 110, 083510 [NASA ADS] [CrossRef] [Google Scholar]
- Bulbul, E., Liu, A., Kluge, M., et al. 2024, A&A, 685, A106 [NASA ADS] [CrossRef] [EDP Sciences] [Google Scholar]
- Cavaliere, A., & Fusco-Femiano, R. 1976, A&A, 49, 137 [NASA ADS] [Google Scholar]
- Cavaliere, A., & Fusco-Femiano, R. 1978, A&A, 70, 677 [NASA ADS] [Google Scholar]
- Clerc, N., Comparat, J., Seppi, R., et al. 2024, A&A, 687, A238 [NASA ADS] [CrossRef] [EDP Sciences] [Google Scholar]
- Coziol, R., Andernach, H., Caretta, C. A., Alamo-Martínez, K. A., & Tago, E. 2009, AJ, 137, 4795 [NASA ADS] [CrossRef] [Google Scholar]
- Cruise, M., Guainazzi, M., Aird, J., et al. 2025, Nat. Astron., 9, 36 [Google Scholar]
- De Luca, A., & Molendi, S. 2004, A&A, 419, 837 [NASA ADS] [CrossRef] [EDP Sciences] [Google Scholar]
- Dunkley, J., Komatsu, E., Nolta, M. R., et al. 2009, ApJS, 180, 306 [NASA ADS] [CrossRef] [Google Scholar]
- Ghirardini, V., Bulbul, E., Artis, E., et al. 2024, A&A, 689, A298 [NASA ADS] [CrossRef] [EDP Sciences] [Google Scholar]
- Grandis, S., Ghirardini, V., Bocquet, S., et al. 2024, A&A, 687, A178 [NASA ADS] [CrossRef] [EDP Sciences] [Google Scholar]
- Harnden, F. R., Fabricant, D. G., Harris, D. E., & Schwarz, J. 1984, SAO Special Report, 393 [Google Scholar]
- Huchra, J. P., Vogeley, M. S., & Geller, M. J. 1999, ApJS, 121, 287 [Google Scholar]
- Huchra, J. P., Macri, L. M., Masters, K. L., et al. 2012, ApJS, 199, 26 [Google Scholar]
- Kleinebreil, F., Grandis, S., Schrabback, T., et al. 2025, A&A, 695, A216 [NASA ADS] [CrossRef] [EDP Sciences] [Google Scholar]
- Kowalski, M., Rubin, D., Aldering, G., et al. 2008, ApJ, 686, 749 [NASA ADS] [CrossRef] [Google Scholar]
- Kuntz, K. D., & Snowden, S. L. 2008, A&A, 478, 575 [NASA ADS] [CrossRef] [EDP Sciences] [Google Scholar]
- Leccardi, A., & Molendi, S. 2008, A&A, 486, 359 [NASA ADS] [CrossRef] [EDP Sciences] [Google Scholar]
- Lovisari, L., Reiprich, T. H., & Schellenberger, G. 2015, A&A, 573, A118 [NASA ADS] [CrossRef] [EDP Sciences] [Google Scholar]
- Mahdavi, A., Böhringer, H., Geller, M. J., & Ramella, M. 2000, ApJ, 534, 114 [NASA ADS] [CrossRef] [Google Scholar]
- McCammon, D., Almy, R., Apodaca, E., et al. 2002, ApJ, 576, 188 [NASA ADS] [CrossRef] [Google Scholar]
- Migkas, K., Schellenberger, G., Reiprich, T. H., et al. 2020, A&A, 636, A15 [NASA ADS] [CrossRef] [EDP Sciences] [Google Scholar]
- Newville, M., Stensitzki, T., Allen, D. B., & Ingargiola, A. 2014, https://doi.org/10.5281/zenodo.11813 [Google Scholar]
- Okabe, N., Reiprich, T., Grandis, S., et al. 2025, A&A, 700, A46 [NASA ADS] [CrossRef] [EDP Sciences] [Google Scholar]
- Pacaud, F., Pierre, M., Refregier, A., et al. 2006, MNRAS, 372, 578 [NASA ADS] [CrossRef] [Google Scholar]
- Planck Collaboration XXIV. 2016, A&A, 594, A24 [NASA ADS] [CrossRef] [EDP Sciences] [Google Scholar]
- Pointecouteau, E., Reiprich, T. H., Adami, C., et al. 2013, ArXiv e-prints [arXiv:1306.2319] [Google Scholar]
- Pratt, G. W., Arnaud, M., Biviano, A., et al. 2019, Space Sci. Rev., 215, 82 [Google Scholar]
- Press, W. H., & Schechter, P. 1974, ApJ, 187, 425 [Google Scholar]
- Ramella, M., Geller, M. J., Pisani, A., & da Costa, L. N. 2002, AJ, 123, 2976 [NASA ADS] [CrossRef] [Google Scholar]
- Ramos-Ceja, M. E., Pacaud, F., Reiprich, T. H., et al. 2019, A&A, 626, A48 [NASA ADS] [CrossRef] [EDP Sciences] [Google Scholar]
- Reiprich, T. H. 2006, A&A, 453, L39 [NASA ADS] [CrossRef] [EDP Sciences] [Google Scholar]
- Reiprich, T. H., & Böhringer, H. 2002, ApJ, 567, 716 [Google Scholar]
- Reiprich, T. H., Sarazin, C. L., Kempner, J. C., & Tittley, E. 2004, ApJ, 608, 179 [Google Scholar]
- Sanderson, A. J. R., Ponman, T. J., Finoguenov, A., Lloyd-Davies, E. J., & Markevitch, M. 2003, MNRAS, 340, 989 [Google Scholar]
- Schellenberger, G., & Reiprich, T. H. 2017a, MNRAS, 471, 1370 [Google Scholar]
- Schellenberger, G., & Reiprich, T. H. 2017b, MNRAS, 469, 3738 [CrossRef] [Google Scholar]
- Seppi, R., Comparat, J., Bulbul, E., et al. 2022, A&A, 665, A78 [NASA ADS] [CrossRef] [EDP Sciences] [Google Scholar]
- Seppi, R., Comparat, J., Nandra, K., et al. 2023, A&A, 671, A57 [NASA ADS] [CrossRef] [EDP Sciences] [Google Scholar]
- Sheth, R. K., & Tormen, G. 1999, MNRAS, 308, 119 [Google Scholar]
- Skrutskie, M. F., Cutri, R. M., Stiening, R., et al. 2006, AJ, 131, 1163 [NASA ADS] [CrossRef] [Google Scholar]
- Smith, R. J., Lucey, J. R., Hudson, M. J., Schlegel, D. J., & Davies, R. L. 2000, MNRAS, 313, 469 [NASA ADS] [CrossRef] [Google Scholar]
- Struble, M. F., & Rood, H. J. 1999, ApJS, 125, 35 [Google Scholar]
- Tempel, E., Kruuse, M., Kipper, R., et al. 2018, A&A, 618, A81 [NASA ADS] [CrossRef] [EDP Sciences] [Google Scholar]
- Tinker, J., Kravtsov, A. V., Klypin, A., et al. 2008, ApJ, 688, 709 [Google Scholar]
- Veronica, A., Su, Y., Biffi, V., et al. 2022, A&A, 661, A46 [NASA ADS] [CrossRef] [EDP Sciences] [Google Scholar]
- Vikhlinin, A., Burenin, R. A., Ebeling, H., et al. 2009, ApJ, 692, 1033 [Google Scholar]
- Wegner, G., Bernardi, M., Willmer, C. N. A., et al. 2003, AJ, 126, 2268 [NASA ADS] [CrossRef] [Google Scholar]
- Willingale, R., Starling, R. L. C., Beardmore, A. P., Tanvir, N. R., & O’Brien, P. T. 2013, MNRAS, 431, 394 [Google Scholar]
- Xu, W., Ramos-Ceja, M. E., Pacaud, F., Reiprich, T. H., & Erben, T. 2018, A&A, 619, A162 [NASA ADS] [CrossRef] [EDP Sciences] [Google Scholar]
- Xu, W., Ramos-Ceja, M. E., Pacaud, F., Reiprich, T. H., & Erben, T. 2022, A&A, 658, A59 [NASA ADS] [CrossRef] [EDP Sciences] [Google Scholar]
Appendix A: Surface brightness profiles
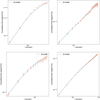 |
Fig. A.1. Cumulative sky-background-subtracted flux in the 0.5 − 2 keV energy band and the best-fit β model for Group 2 (top left) AS0924 (top right), Group 3 (bottom left), and Group 4 (bottom right). |
Appendix B: Extracted spectra
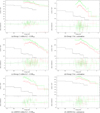 |
Fig. B.1. EPIC-pn and EPIC-MOS2 spectra of the systems along with the best-fit models and residuals - part 1. |
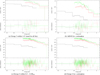 |
Fig. B.2. EPIC-pn and EPIC-MOS2 spectra of the systems along with the best-fit models and residuals - part 2. |
All Tables
XMM-Newton observation ID, clean exposure time, coordinates, and estimated redshift for our sample according to the RASS detection (X22, https://github.com/wwxu/rxgcc.github.io).
Starting values for the parameters describing the cosmic X-ray background in our spectral model.
All Figures
|
Fig. 1. The red circles in the RASS photon images (left, in the 0.5 − 2 keV energy band) indicate the position and extent of the detection from X22. The dashed magenta circles show the FoV of the XMM-Newton observation, and the green boxes serve as a 1° ×1° ruler. The blue contours show the smoothed signal from the wavelet filtered images used to detect the source. The XMM-Newton count-rate images (right, 0.4 − 1.25 keV) are instrumental-background-subtracted and smoothed by a 7.5′′ Gaussian kernel. The labels indicate the position of the main sources discussed in the paper. The white circles mark the R500 (0.5 R500 when dashed) of the groups that we determined in this study (Sect. 4). Magenta circles around known galaxy clusters have an arbitrary size of 2′. Matching known galaxies from NED are marked with small circles of various colors and were used for group and cluster redshift estimates (Sect. 3): Panel b: for Group 1 in green and Group 2 in cyan. Panel d: for Group 3 none, AS0924 and A3742 in green, and A3745 in yellow. Panel f: for Group 4 and [TKK2018] 859 in green and A0349 in yellow. (a) RASS image of RXGCC 127. (b) XMM-Newton image of RXGCC 127. (c) RASS image of RXGCC 841. (d) XMM-Newton image of RXGCC 841. (e) RASS image of RXGCC 104. (f) XMM-Newton image of RXGCC 104. |
| In the text | |
|
Fig. 2. Flux comparison of ROSAT and XMM-Newton for the observations of RXGCC 127 in the 0.5 − 2 keV energy range. The integrated-flux profiles are background-subtracted. |
| In the text | |
|
Fig. 3. Cumulative sky-background-subtracted flux in the 0.5 − 2 keV energy band and the best-fit β model for Group 1. |
| In the text | |
|
Fig. A.1. Cumulative sky-background-subtracted flux in the 0.5 − 2 keV energy band and the best-fit β model for Group 2 (top left) AS0924 (top right), Group 3 (bottom left), and Group 4 (bottom right). |
| In the text | |
|
Fig. B.1. EPIC-pn and EPIC-MOS2 spectra of the systems along with the best-fit models and residuals - part 1. |
| In the text | |
|
Fig. B.2. EPIC-pn and EPIC-MOS2 spectra of the systems along with the best-fit models and residuals - part 2. |
| In the text | |
Current usage metrics show cumulative count of Article Views (full-text article views including HTML views, PDF and ePub downloads, according to the available data) and Abstracts Views on Vision4Press platform.
Data correspond to usage on the plateform after 2015. The current usage metrics is available 48-96 hours after online publication and is updated daily on week days.
Initial download of the metrics may take a while.