Open Access
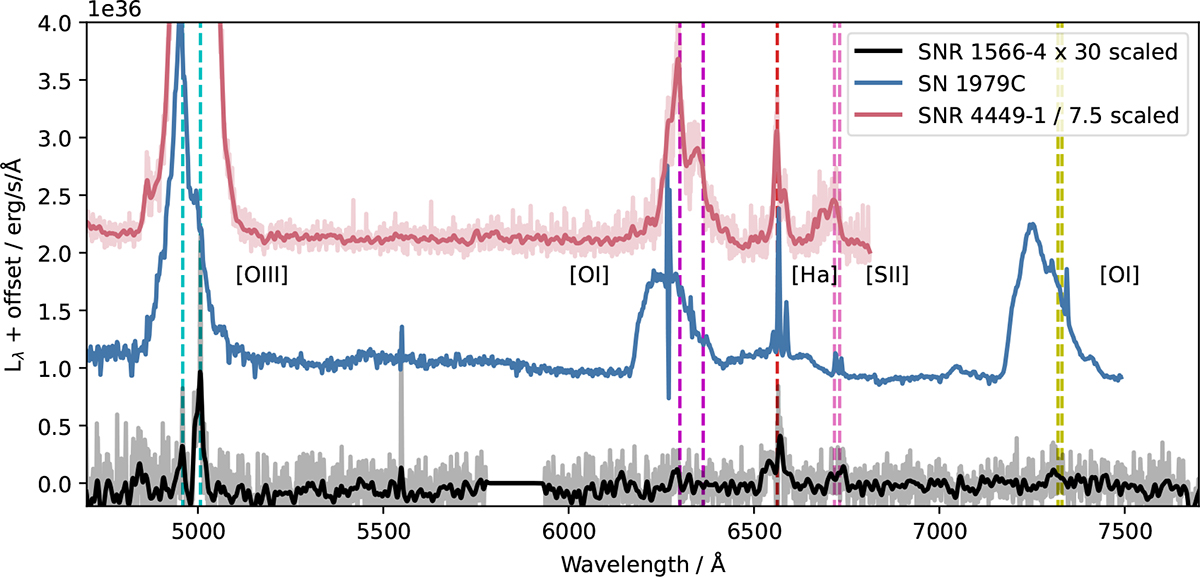
Fig. 15.
Download original image
Comparison of SNR 1566-4, SNR 4449-1 and SN 1979C. Solid lines are smoothed spectra, shaded represents the original spectrum. Vertical lines indicate different emission lines; [O III] (cyan), [OI] (magenta), Hα (red), [S II] (pink) and [OII] (yellow).
Current usage metrics show cumulative count of Article Views (full-text article views including HTML views, PDF and ePub downloads, according to the available data) and Abstracts Views on Vision4Press platform.
Data correspond to usage on the plateform after 2015. The current usage metrics is available 48-96 hours after online publication and is updated daily on week days.
Initial download of the metrics may take a while.