Open Access
Fig. 2.
Download original image
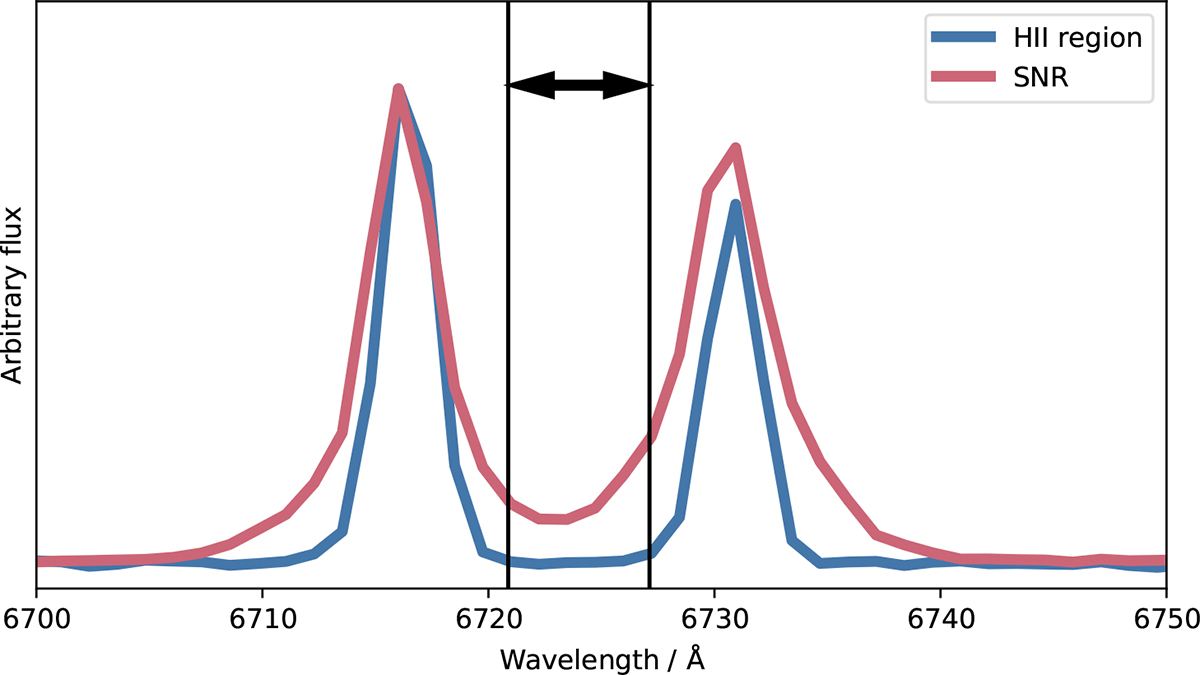
Comparison of [SII]λλ6717,6731 emission lines from a SNR and an HII region, scaled to similar peak fluxes. The area bounded by black vertical lines (black arrows) is extracted and continuum subtracted. The difference in flux extracted between the two sources is apparent.
Current usage metrics show cumulative count of Article Views (full-text article views including HTML views, PDF and ePub downloads, according to the available data) and Abstracts Views on Vision4Press platform.
Data correspond to usage on the plateform after 2015. The current usage metrics is available 48-96 hours after online publication and is updated daily on week days.
Initial download of the metrics may take a while.