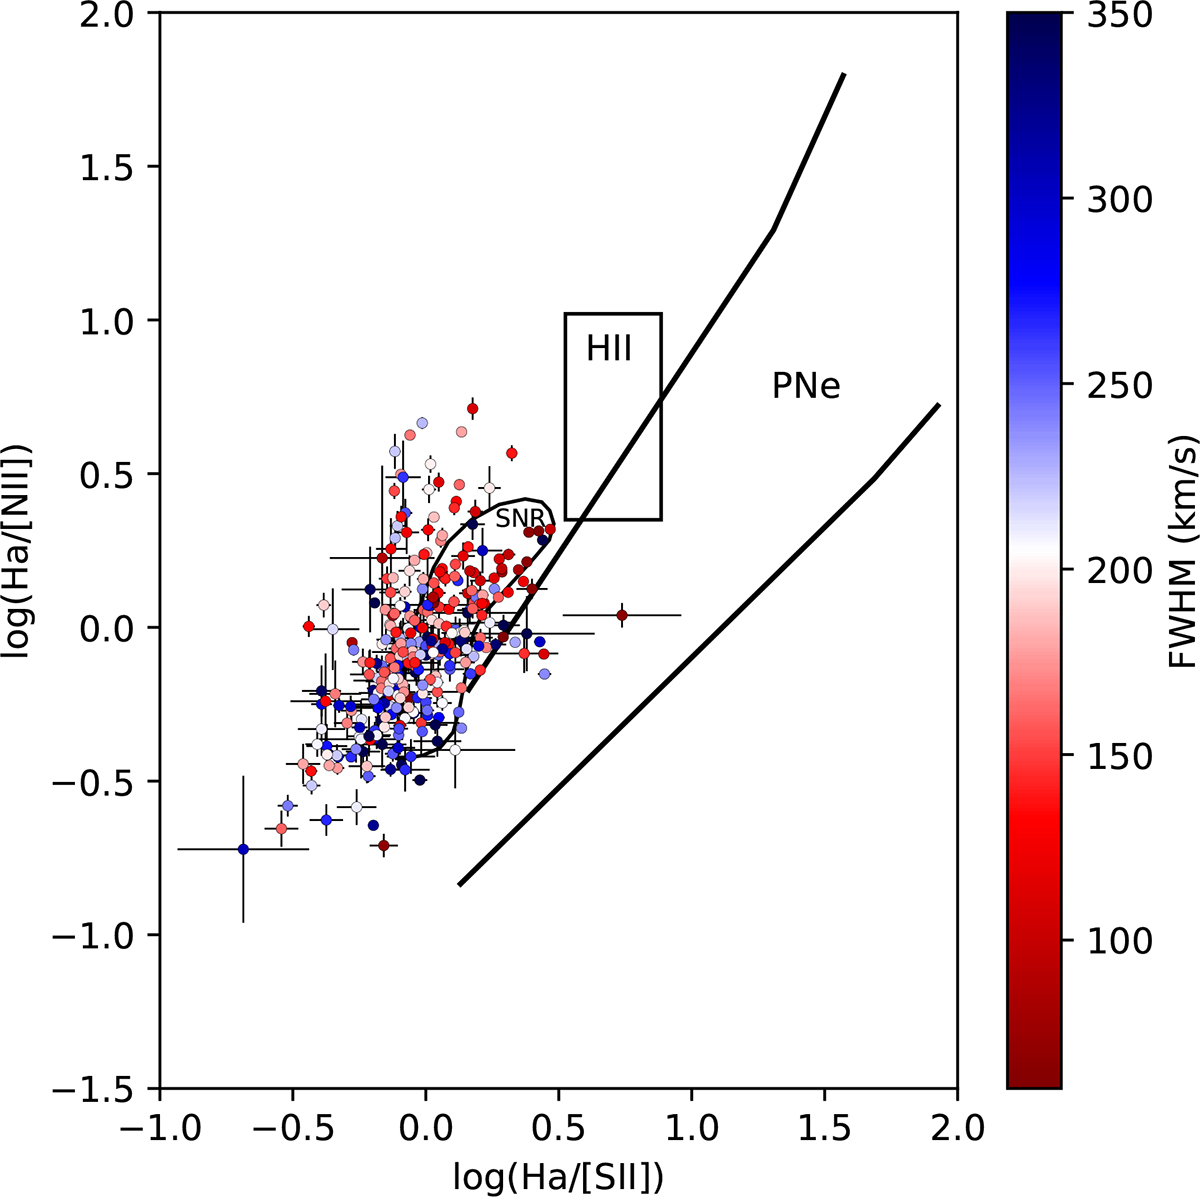
Fig. 3.
Download original image
Our sample of broadened emission lines that have detectable Hα, [N II]λ6583 and [S II]λλ6717,6731 emission lines and that we identify as SNRs. Colour of the points represent the FWHM of the [N II]λ6583 with the instrumental broadening removed. The different regions in the figure have been adopted from Meaburn et al. 2010. Most of our sample aligns with the SNR region with log(Hα/[S II]) < 0.5.
Current usage metrics show cumulative count of Article Views (full-text article views including HTML views, PDF and ePub downloads, according to the available data) and Abstracts Views on Vision4Press platform.
Data correspond to usage on the plateform after 2015. The current usage metrics is available 48-96 hours after online publication and is updated daily on week days.
Initial download of the metrics may take a while.